Protocol Granularity report
The Protocol Granularity report shows the Vuser script's protocol usage.
 and select Reports.
Tip:
-
When viewing graphs, you can show or hide an element on the graph by clicking the element name in the legend. To zoom in on a portion of a bar or line graph, place the mouse on the graph, hold the left mouse button down, and drag across the area of interest. Use Reset Zoom to go back to the previous view.
-
When viewing grids, you can sort a grid according to the values of any column. The arrow in the heading displays whether the column is sorted in ascending or descending order. Click the column heading to reverse the order.
User interface elements are described below:
|
UI Elements |
Description |
|---|---|

|
My Performance Center: Click arrow and select time range for the report. |
| <Report toolbar> |
Performance Center Administration: For report toolbar details, see Reporting Summary. Displays the selected time range and the number of projects included in the report. Click
|
|
Export Reports |
Enables exporting a Vuser script's protocol usage information to a CSV file. The report time range and projects are determined according to what was set in the filter and displayed in the report toolbar.
Available in versions: 12.62 and later, and in Performance Center Administration only. |
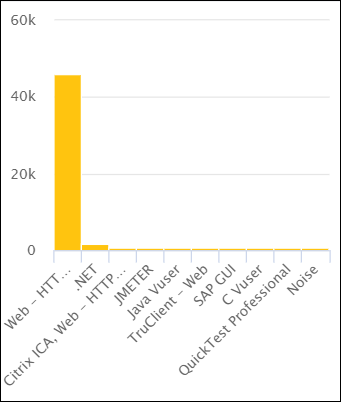
| Protocol Vusers Distribution |
Displays protocol Vusers distribution during performance test runtime.
|
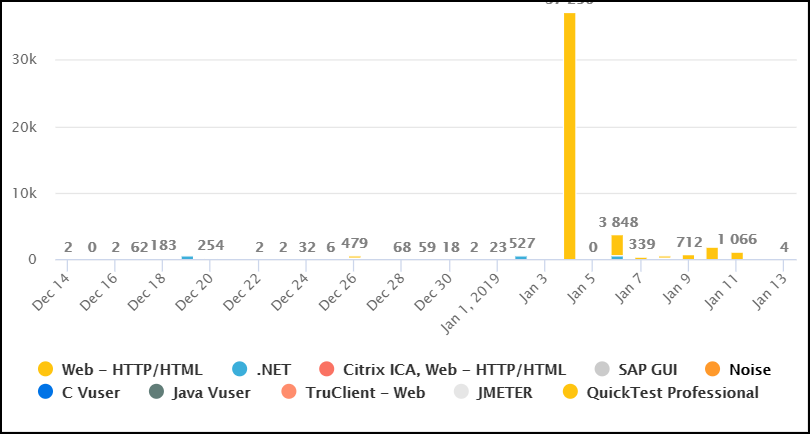
| Accumulated Usage Per Period |
Displays total protocol Vusers usage by dates.
|
| Protocol | The Vuser script's protocol. |
| Total Vusers |
The total number of Vusers usage by the protocol during performance test runtime. |
| Avg Per Run |
The average number of Vusers per run by the protocol during performance test runtime. |
| Max Per Run |
The maximum number of Vusers per run by the protocol during performance test runtime. |
| Avg Concurrent |
The average number of concurrent Vusers per run by the protocol during performance test runtime. |
| Max Concurrent |
The maximum number of concurrent Vusers per run by the protocol during performance test runtime. |
| Total Vusers | The total number of Vusers usage for all protocols during performance test runtime. |
| Total Runs | The total number of all runs during performance test runtime. |
 Filter to select the time range and projects: