Customize project planning and tracking KPIs
You can create and customize the project planning and tracking (PPT) KPIs.
ALM Editions: The Project Planning and Tracking link in Project Customization is available for ALM Edition only. For more information about ALM editions and their functionality, see
About PPT KPIs
PPT collects data from the milestones of your release using key performance indicators (KPIs). A KPI is a quantifiable measure designed to track a critical performance variable over time, and measure the essential outcome of quality assurance activities. You can customize each KPI to reflect your needs. You can customize system-defined KPIs or create user-defined KPIs.
When analyzing the overall health and deployment readiness of your release in the PPT scorecard, you can further enhance your output by customizing the KPI graphs displayed in your scorecard.
For more details on PPT, see Project Planning and Tracking (PPT) Releases.
Create and customize a PPT KPI
Follow the steps below to create and customize PPT KPIs.
-
In the Project Customization window, in the left pane, click Project Planning and Tracking.
-
To create a new KPI, click New. Enter a name and select an entity type and measurement type for the new KPI. Click OK.
To create a KPI from an existing KPI, select the existing KPI and click Create as. Enter a name for the new KPI. Click OK.
To filter KPIs by entity type, from the Filter By list, select the associated entity type. To view all KPI types, select None.
-
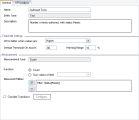
In the General tab, configure the KPI's general properties.
Threshold Settings
KPI is better when values are
The expected growth direction of the values of the selected KPI. The higher or lower the value, the better it is.
Default value: Higher
Default Threshold OK Above/Below
A value greater than the specified amount indicates a good KPI state.
Warning Range
A percentage value relevant to the OK Above/Below threshold. If a KPI is better when a value is higher and the OK Above threshold is set to 100, and the warning range is set to 10%, then any value between 90 and 100 will trigger a warning. Any value below 90 indicates a bad KPI state.
Measurement
Measurement Type
The method of measurement. Cannot edit it after the KIP is created.
When the KPI's measurement type is Percentage, the Measure percentage of section indicates the numerator to be used for percentage calculations. The Out of section indicates the denominator to be used for percentage calculations.
Function
Indicates one of the following:
-
Count. Counts the number of entities.
-
Sum values of field. Totals the values of a specified field for all the entities.
Measured Entities
Enables you to filter on entities of the type specified for the selected KPI:
-
 Set Filter/Sort. Opens the Filter dialog box enabling you to define a filter. For details, see Filter Dialog Box.
 -
 Clear Filter. Clears the defined filter.
Consider Transitions
Enables the Configure button.
When transitions are configured, the KPI aggregates field changes instead of counting the changes.
Opens the Configure Transitions dialog box, enabling you to define how field changes are counted when measuring KPI values.
-
Measure changes in field. Indicates the field used for aggregating field value changes.
-
When value changes from. Aggregates when the value changes from the specified field value. The value $ANY aggregates irrespective of the currently displayed value.
-
When value changes to. Aggregates when the value changes to the specified field value. The value $ANY aggregates irrespective of the currently displayed value.
-
Update List. Opens the Measure Values dialog box, enabling you to select the values to be used when measuring changes.
-
Accumulate changes. Enables you to aggregate changes on a daily basis; for the duration of a milestone; or for the duration of a release.
-
-
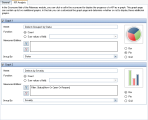
In the KPI Analysis tab, define two additional breakdown graphs for inclusion in the KPI Drilldown graph. For details, see KPI Drill Down Graph.
Graph 1/Graph 2
Enables/disables the graph.
Name
The name of the graph.
Function
Choose one of the following:
-
Count. Counts the number of entities.
-
Sum values of field. Totals the values of a specified field for all the entities.
Measured Entities
Enables you to filter on entities of the type specified for the selected KPI:
-
 Set Filter/Sort. Opens the Filter dialog box enabling you to define a filter. For details, see Filter Dialog Box.
 -
 Clear Filter. Clears the defined filter.
Group By
Determines the fields by which ALM groups data in the graph.
Bar/Pie/Grid
Indicates the type of graph.
-
- Click Save to save your changes.
 See also:


