Share this page


Generating Predefined Graphs
You can create predefined graphs during your work in the Requirements, Test Plan, Test Lab, Business Components, and Defects modules. Predefined graphs enable you to create several types of graphs in each module, using the existing module filter. You can use predefined graphs for one-time reference, or save them in the Analysis View module, where you can continue to configure their data and appearance.
In this exercise, you will generate a summary graph from the Defects module.
To generate a predefined graph:
-
Display the Defects module.
On the ALM sidebar, select Defects.
-
Clear the Defects grid filter.
Click the Set Filter/Sort arrow, and choose Clear Filter/Sort to clear the filter that is applied to the grid.
-
Generate a report.
Choose Analysis > Graphs > Defects Summary - Group by Status. The graph window opens, displaying the selected graph.
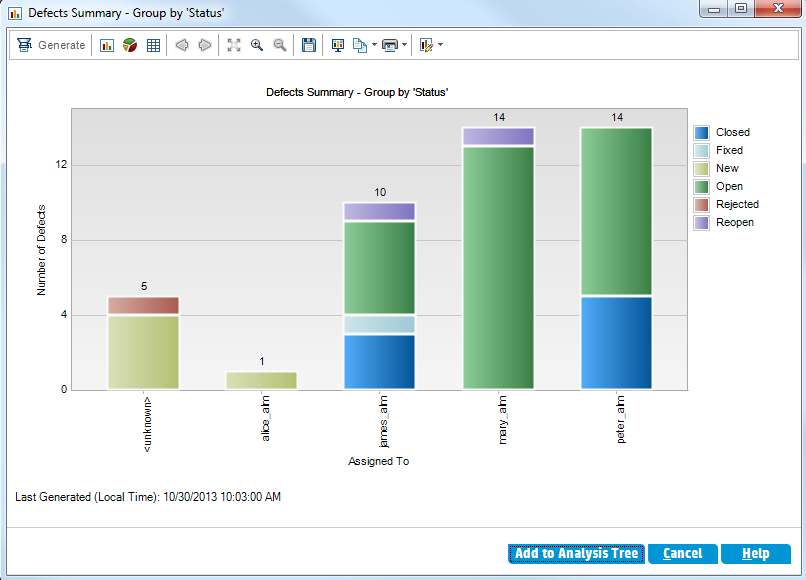
The graph shows the number of defects that exist in your project, according to the people to whom they are assigned. Defects in the graph’s columns are grouped according to their status.
-
Close the graph window.
Click the Cancel button.