Share this page


The Edit Categories dialog box enables you to group together values of the field selected in the Grouped By or the X-axis field, and display the combined data as one category.
To edit categories of a graph's view:
Note: Instructions below do not apply to the graphs that are using the classic view. If you want to edit categories for such graphs, see Edit Categories (for classic graph view).
-
On the View tab of the graph, click Edit Categories
 to open the Edit Categories dialog box.
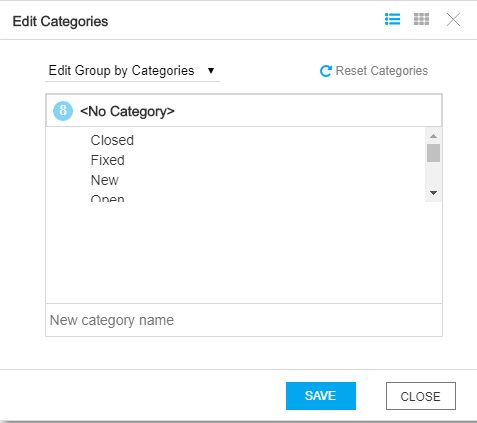
-
To group values of the field selected in the X-axis field, select Edit X-Axis Categories from the drop-down list. This option is available only for summary graphs, Business Value graphs, and Requirements Coverage graphs.
To group values of the field selected in the Group By field, select Edit Group by Categories from the drop-down list.
By default, all X-axis or group-by field values are listed under the <No Category> group.
-
Create new categories.
To create a new category, in the New category name text box, enter a name for the category, and click
 .
. -
Add groups into new categories.
You can add groups into a new category in either of the following way.
Drag and drop groups into the new category - In the top-right corner, click
 to open the Category view.
 - Drag and drop the groups from the <No Category> area or any existing categories area to the new category area.
Assign the new category to target groups - In the top-right corner, click
 to open the Grid view.
 -
In the Categories column, select the new category name for the groups that you want to add.
The number displayed before each category name indicates how many groups are added under this category.
- In the top-right corner, click
-
Click Save to save all the categories.
To delete a specific category, in the Category view, click the delete icon in the category line.
To delete all categories, click Reset Categories.
Edit Categories (for classic graph view)
This section describes how to edit categories for graphs that are using the classic view.
 .
.User interface elements are described below:
|
UI Element |
Description |
|---|---|
|
Opens the New Category dialog box, enabling you to create a new category. In the Category Name box, type a name for the category. To choose which field values are included in the category, select field values and click the arrow buttons (> and <) to move them between Available groups and Groups in new category. Click the double arrow buttons (>> and <<) to move all the field values from one list to the other. You can also drag field values between lists. You cannot include a field value in more than one category. |
|
|
Opens the Edit Category dialog box, enabling you to edit the selected category. |
|
|
Deletes the selected category. |
|
|
Deletes all categories. |
|
| # | The number of the category. |
| Name | The name of the category. |
| Expression | The values included in the category. |


 See also: