Share this page


Generating Business View Graphs in the Analysis View Module
In this exercise, you will use the graph wizard to generate a business view graph that summarizes the requirements by status and priority level.
To generate a business view graph in the Analysis View module:
-
Make sure the Analysis View module is displayed.
If the Analysis View module is not displayed, on the ALM sidebar, under Dashboard, select Analysis View.
-
Open the graph wizard.
Click the New Item button and select Graph Wizard. The graph wizard opens to the Select Graph Type page.
-
Select the graph type.
Select Business View Graph.
-
Select the business view.
-
Click Next. The Select Business View page opens.
-
Select Requirements.
-
-
Select the projects to include.
-
Click Next. The Select Projects page opens.
-
You can include data from multiple projects in the graph. For this exercise, we will use only the current project. Make sure Use Current Project is selected.
-
-
Define a filter to view requirements with high to urgent priority.
-
Click Next. The Select Filter page opens.
-
Click the down arrow in the Criteria column adjacent to the Priority field. The Select Filter Condition dialog box opens.
-
In the right pane, select the logical expression >=.
-
In the left pane, select 3-High. The condition appears as follows:

-
Click OK to close the Select Filter Condition dialog box.
-
-
Define a filter to view defects that are not closed.
-
Click the down arrow in the Criteria column adjacent to the Reviewed field. The Select Filter Condition dialog box opens.
-
In the left pane, select Not Reviewed. The condition appears as follows:

-
Click OK to close the Select Filter Condition dialog box.
-
-
Set the graph attributes.
-
Click Next. The Select Graph Attributes page opens.
-
Under X-axis, select Priority and under Y-axis, select Count to view the number of requirements by priority.
-
Under Grouped By, make sure that it is set to <None>.
-
-
Generate the Graph.
Click Finish. The graph is displayed in the graph window.
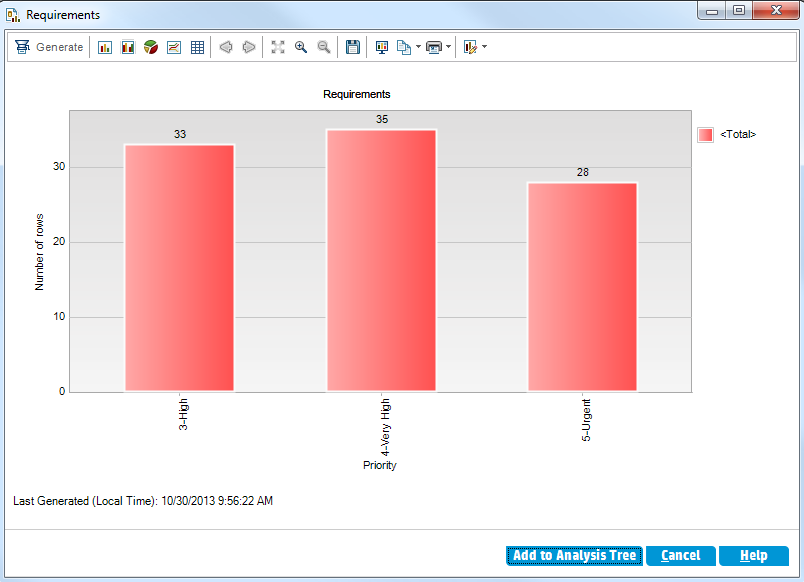
The graph shows a summary of requirements with High to Urgent priority that have not been reviewed.
-
Save the graph in the Analysis View module.
-
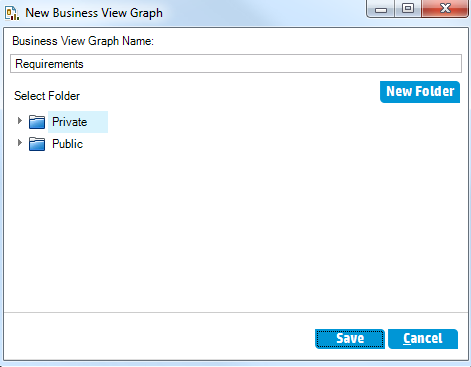
Click Add to Analysis Tree. The New Business View Graph dialog box opens.
-
Expand the Private folder, and select My_Analysis_Items.
-
Click Save. The Requirements graph is saved in the analysis tree, and displayed in the View tab.
-
-
Display other graph views.
-
Click the Pie Chart button to display the graph as a pie chart.
-
Click the Data Grid button to display the data as a grid.
-