Share this page


You can create a composite graph to view and compare data among two or three graphs at the same time.
Create a composite graph
-
On the ALM sidebar, under Dashboard, select Analysis View.
-
Right-click a folder, and select New Composite Graph. Enter a name for the composite graph.
-
Click OK.
The graph is added in the Analysis tree and you can see the graph automatically generated in the View tab.

Configure a composite graph
You configure a composite graph to control which graphs are compared in the composite graph and how they are displayed in the composite graph.
To configure a composite graph:
-
From the Analysis tree, select the composite graph.
-
Click the Configuration tab.
-
Add the graphs to be included in the composite graph.
To add a graph:
- From the right panel, select the graph.
-
Drag and drop the graph to the middle gray area. Alternatively, click the Add button.
Note the following when adding graphs to a composite graph:
A composite graph can include up to 3 graphs. A composite graph can include up to 3 graphs, regardless of whether they are generated for the same project.
Builds, Code Change, and BV graphs are not supported by composite graphs. You cannot add Builds, Code Changes, or BV graphs to a composite graph. Restrictions for entity graphs Which types of entity graphs can coexist in a composite graph?
-
Time series graphs (graphs whose x-axis values are dates), such as trend, progress, and plan vs. actual graphs.
-
Non-time-series graphs (graphs whose x-axis values are text), such as age and summary graphs.
After you select a graph, the graphs of the incompatible graph types are grayed out in the graph tree.
The following entity graphs are not supported by composite graphs:
-
Planned vs. Actual (Last Test Run)
-
Planned vs. Actual (Test Run History)
-
Test Execution Status Trend Graph
-
Search graphs. Use the search box to filter only the entity graphs that contains the search keyword in the graph title.
Created by me. Check this option to filter only the entity graphs you created.
 . Views the graph from the Analysis tree (go to the View tab of the graph).
 -
Edit how the selected graphs will be displayed in the composite graph.
For each graph, you can do the following in the graph card.
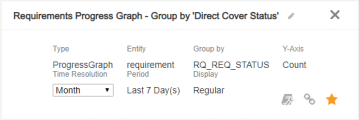
Change graph title Click the edit icon next to the graph title to rename the graph.
It does not really change the graph title. The new name applies only when the graph is presented in the composite graph.
Set time resolution Applicable to progress and trend graphs only.
In the Time Resolution field, specify the time interval at which data is grouped on the x-axis.
If the graphs included in a composite graph have different time resolution settings, the composite graph listens to the time resolution of the primary graph.
View graph filters Hover over the filters icon (  ) to see the filters of the graph.
Set primary graph Click
 to set the graph as the primary graph. The primary graph by default has a darker shade than non-primary graphs in the composite graph.
By default, the first graph you add to the composite graph is the primary graph.
View graph in Analysis Click to view the graph from the Analysis tree (go to the View tab of the graph). It enables you to re-configure the graph if you want to have the graph present a different set of data in the composite graph.Change graph order Drag and drop the graph up or down.

Set composite graph appearance
To customize the graph title, graph color, and graph display, in the View tab, click Set Graph Appearance  to open the Graph Appearance dialog box.
| UI Element | Description |
|---|---|
| General tab | |
| Title section |
Enables you to change the titles of the graph, the y-axis, or the x-axis.
|
| Layout section |
|
| Color |
Color Theme. Select a color theme for the graph. Groups in the graph will be automatically displayed in different colors under the color theme. If the graph has more than 6 groups, some groups will share the same colors. Group Color. Select any colors for the groups in the graph. If it is a composite graph, select any colors for the source graphs and the percentage line in the composite graph. The group or source graph color settings override the color theme setting. Outer Color. Select a color for the area outside the graph. Inner Color. Select a color for the inner part of the graph. Auxiliary. Select colors for positive and negative values in the auxiliary line. Available only when auxiliary line is enabled. |
| Opacity |
Set the opacity for the primary graph and non-primary graphs in a composite graph. |
| Column Parameters |
Show Data Label. Whether or not to display labels for each column. A label can be number or text. Label Type. This option works only when Show Data Label is enabled. Select one of the following:
Label Position. This option works only when Show Data Label is enabled. Select where the labels are displayed: on the top, at the bottom, or in the middle of the column.
Visible marks. Whether or not to display marks for each column. A mark can be number or text. Marks style. This option works only when is Visible marks enabled. Select one of the following styles:
Marks position: This option works only when Visible marks is enabled. Select where the marks are displayed: on the top, at the bottom, or in the middle of the column. |
| Others |
Legend Position. Select where the graph legend is displayed. X-axis Label Direction. Select a text direction for the x-axis label. |
| Data Alignment tab
Available only for composite graphs that contain source graphs whose x-axis values are dates. |
|
| Align by time unit |
Compare graph data within the same time unit, regardless of their actual dates. This options allows you to compare a graph of one period (e.g. Week 1) with the same period (e.g. Week 1) from other graphs, even when the period may refer to different days for the graphs. The period can be day, week, month, or year. X-axis Label. Define how the x-axis values are prefixed with. For example, if you enter “Phase”, the x-axis values are "Phase-1", "Phase-2", and so on. If you want to change the time unit, set the graph's time resolution in the Configuration tab. For details, see Configure a composite graph. X-axis Offset. Move a graph horizontally to adjust where its start point is aligned with other graphs. Click – to move the graph to the left. Click + to move the graph to the right. |
| Align by actual date | Compare graph data based on their actual dates. The x-axis values are the combination of the periods from all graphs. This options allows you to compare graph data of the same date. |
Set composite graph data range
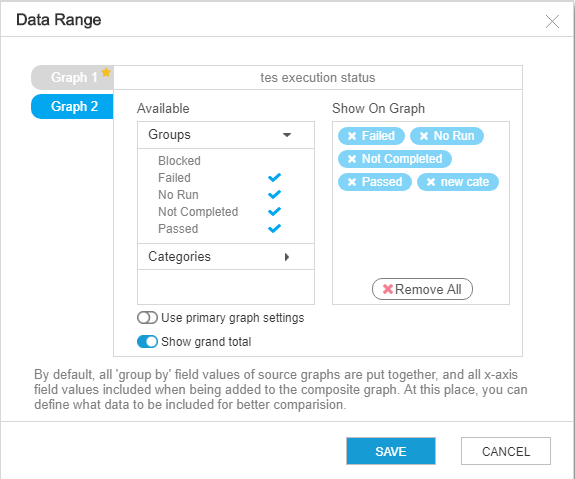
You set the data range of a composite graph to control which groups of data in each source graph will be reflected in the composite graph. Only the numbers of items in selected groups are combined and shown as their total in the composite graph. Items of other groups are ignored.
To set the data range of a composite graph:
- Open the composite graph from the Analysis View.
-
In the View tab, click the Show More Actions icon, and then click Open Graph Data Range
 .
.
-
Select a source graph, and in the Available column, select the groups or categories to show in the composite graph.
- Click Save.
Enable new graph look in email
If you want to send a composite graph by email, first enable the new graph look in email.
To enable the new graph look in email, do the following in the ALM server:
- Install Chrome.
-
Install ChromeDriver from https://chromedriver.chromium.org/downloads. Make sure your ChromeDriver version is compatible with the Chrome version.
-
Run ChromeDriver.
-
Create an xml file, name it alm_webdriver_config.xml, and specify the Chrome and ChromeDriver path in the file.
<WebdriverConfiguration>
    <DriverPath>your ChromeDriver path</DriverPath>
    <ChromeExecutionPath>your Chrome path</ChromeExecutionPath>
    <DriverPort>the ChromeDriver port</DriverPort>
</WebdriverConfiguration>
In Windows, use "\\" as the path separator. In Linux, use "/"as the path separator.
- Store the file in the
{ALM repository}\sa\DomsInfo\Configuration\path.
Note: If ALM is deployed in a cluster environment, perform step 1 to step 3 in each node of the cluster, and make sure you deploy Chrome and ChromeDriver respectively in the same path in all nodes.
Show auxiliary line for composite graphs
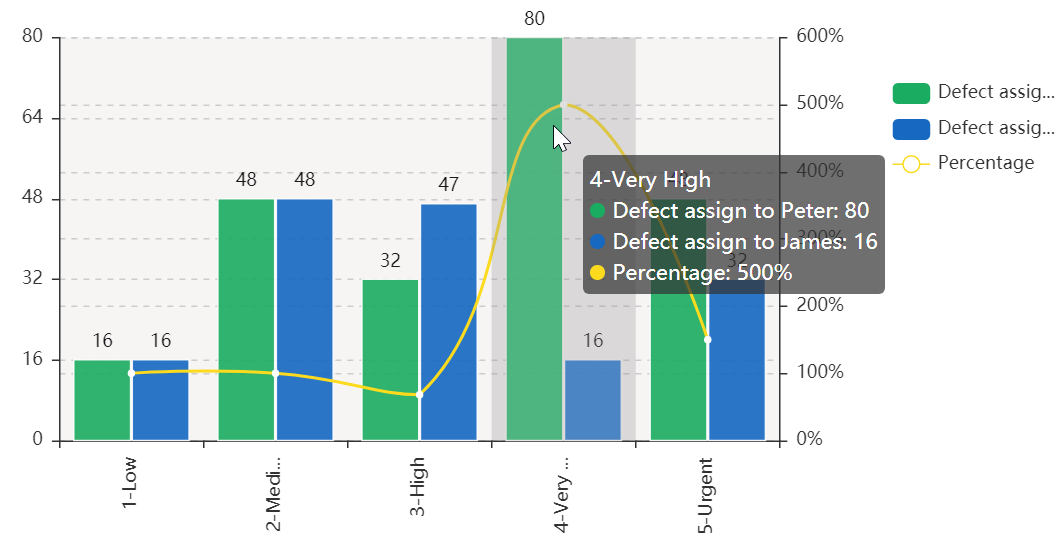
The auxiliary line helps you better visualize the difference between two lines in a composite graph.
| Availability |
Auxiliary line is available for composite graphs that:
|
| How to |
To show the auxiliary line for a composite graph, in the View tab of the graph, click Show More Actions > Show Auxiliary Line If the graphs are age or summary graphs, the auxiliary line shows percentages (primary graph value / non-primary graph). If the graphs are progress or trend graphs, it shows differences (primary graph value - non-primary graph value).
|
 .
.
 See also: