Share this page


License Usage Report
You use the Licenses > License Usage Report tab in Site Administration to monitor license usage for each time interval displayed.
Note: This License Usage Report tab is available to users with the Usage Report permissions.
Overview
You can specify the time interval displayed along the x-axis. You can also specify what information appears in the graph by filtering the graph content by projects, users, or license types.
Example: You may want to charge each department in your organization according to license usage. You can filter by projects in a specific department to view license usage for the department. You can also view license usage for a specific group of users by filtering according to selected users.

Monitor site usage
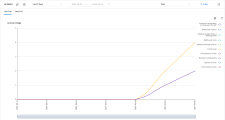
You can monitor the number of licensed users that have connected to an ALM site over a selected period of time. You can analyze the usage level of each module and extension, and track the peak usage level in the current month. The data can be displayed in line graphs or data grids. In addition, you can filter records by projects, users, or license type, and save data to a file.
Note: To monitor the users currently connected to an ALM server. For details, see Monitoring.
To monitor site usage:
-
In Site Administration, click the Licenses > License Usage Report tab.
The License Usage graph is displayed.
UI Element Description 
Toggles the License Usage graph between the Line Chart view and the Data Grid view. 
Copies the License Usage graph to clipboard.
Available in the Line Chart view only.

Prints the License Usage graph.
Available in the Line Chart view only.

Exports license usage graph to a text file.
Available in the Data Grid view only.

Select a set or custom period of time you want the graph to show.
If you select Custom Period, specify the time range.

Select the time period between each measurement. 
Opens the filter dialog box, enabling you to filter graph data by projects, users, or license types.
For details, see Filter license usage.
-
To customize the appearance of a line graph, see License Usage Report.
-
If the graph is displayed in the Data Grid view, you can save the data grid as a text file. For details, see Export license usage data.
-
To refresh data in the graph, click Refresh.
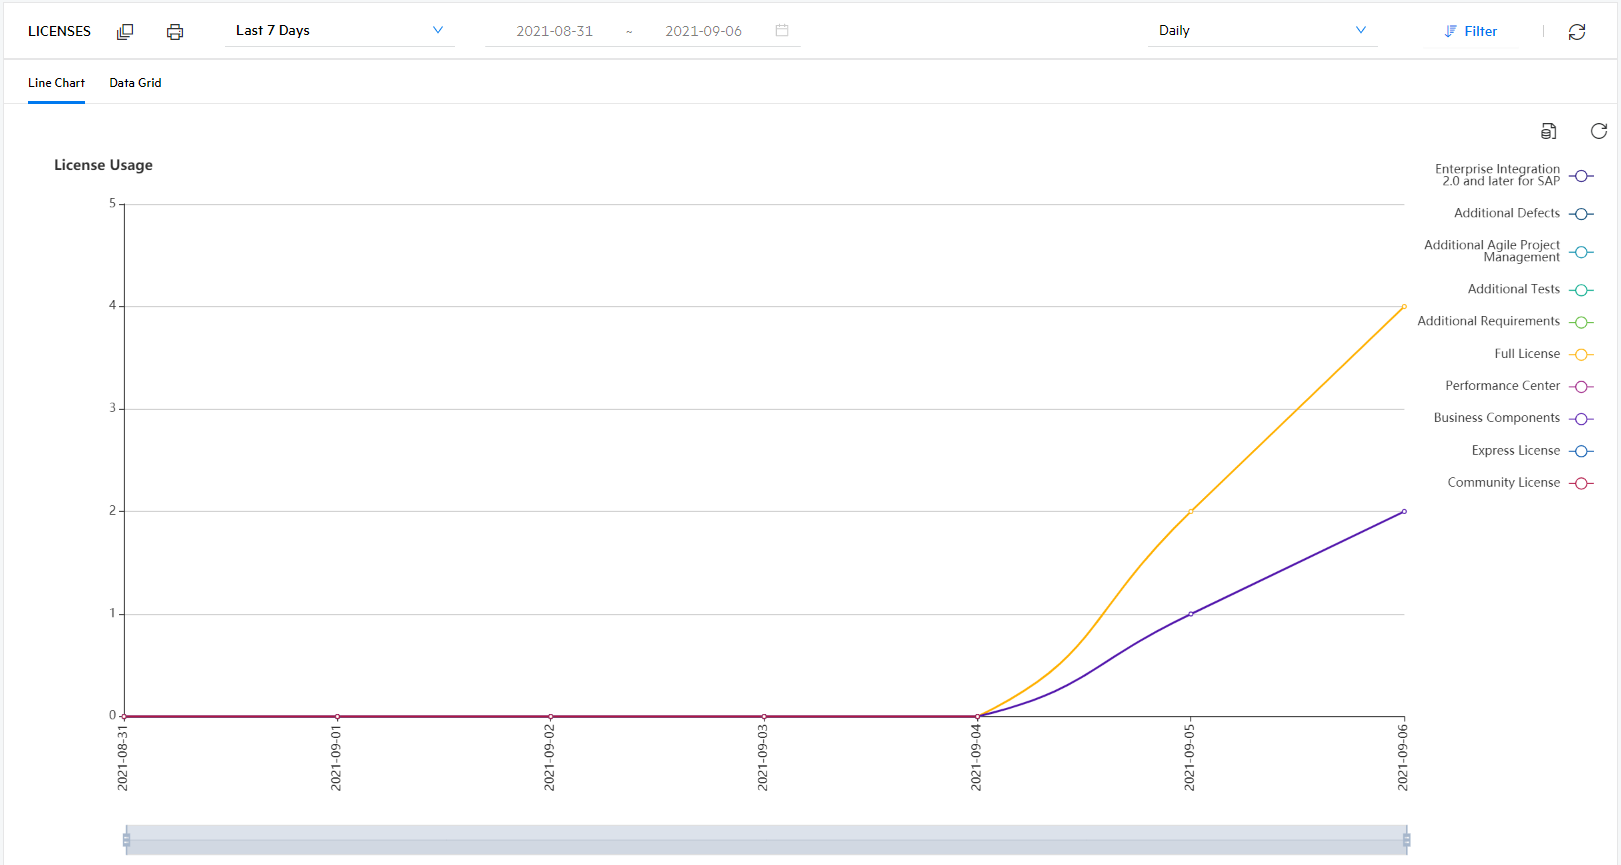
Filter license usage
You can analyze the number of users that have connected to your ALM site at specific points over time by filtering by projects, users, or license types.
To filter license usage:
-
Click Filter.
-
Select the category you want to filter.
For ALM on-premises -
To filter by project, select Project, and then select the projects you want to include.
-
To filter by user, select User, and then select the users you want to include.
For ALM SaaS -
To filter by customer, from the Customer filter, select the target customer.
-
To filter by domains/projects, from the Projects filter, select the target domains/projects.
-
-
Click Generate.
To clear the project or user filter, click Refresh.
To filter license usage by license types:
By default, the graph shows all license types.
To hide a license type, on the right side of the graph, click the legend corresponding to the license type.
Export license usage data
Display the License Usage graph in the Data Grid view, and then you can export the data to a text file.
To export license usage data:
-
Click Data Grid.
-
Specify the period and define the filter.
-
Click Export and select one of the following options.
-
Text Format: Saves the data as a Text file.
-
Excel Sheet: Saves the data as an Excel sheet.
-
Word Document: Saves the data as a Word document.
-
HTML Document: Saves the data as an HTML document.
-
CSV (Comma Separated): Saves the data as a CSV document.
-
You can determine how information appears in the Line Chart graph using the line chart toolbar.
| Zoom in or out |
Use the scale below the graph to increase or decrease the granularity of information.s
|
| Show or hide total values |
Click the Show Total Values button |
| Rotate bottom labels |
Click the Rotate Bottom Labels button |

 to toggle between displaying and hiding a total value in the graph.
 to toggle between vertical and horizontal displays of x-axis labels.
 See also: