Charts
Charts show information relating to the activity in your environment, as a function of the iteration time.
Note: By default, chart generation is disabled. For details on how to enable chart generation, see Enabling charts.
Chart types
The following types of charts are available:
- Quick Glance charts. Graphs describing activity on your synchronizing machine. For details, see Quick glance charts.
- Connection charts. Graphs describing activity within a specific connection. For details, see Connection charts.
Chart legend
The line colors in the charts indicate different measurements.
| Line color | Title | Indicates … |
|---|---|---|
| Green | Volume | the number of items read. |
| Blue | Changes | the number of items modified. |
| Red | Errors | the number of failed changes. |
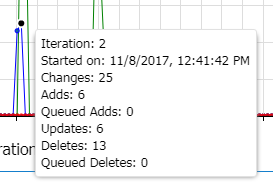
Data point information
To view detailed information, hover over a data point.
The popup shows the iteration number and a time stamp, along with the chart-specific information.

Manipulate a chart
This section describes how to manipulate charts to view the desired information effectively.
-
Zoom and Pan.
 /
/
Pan/Zoom 
Unzoom

Load chart (Project Changes chart only)

Clear selections
(Project Changes chart only) - Resize the chart pane. Drag the window border to the desired size. (Quick Glance charts only)
- Hide the chart pane. Click the left facing arrow to collapse the view. (Quick Glance charts only)
Enabling charts
By default, the charts described in this section are not automatically generated. This behavior preserves CPU usage and memory resources.
To enable the generation of charts, use a java command to set the iteration.polling.enabled global property to true. Run the following command as a user with Site Admin permissions:
java -jar mfcFullRestClient.jar -h localhost:port -c <user,password> -setGlobalPropertyValue -propertyName iteration.polling.enabled -propertyValue true
To disable the generation of charts in order to reduce CPU usage, set the iteration.polling.enabled property back to false.
Note: The Audit chart does not consume CPU and is always generated, regardless of the value of the iteration.polling.enabled property.
 See also:


