Share this page


Quick glance charts
This topic describes the built-in charts in the Connect dashboard.
Charts overview
Quick glance charts give you a overall picture of all synchronization activity. These charts display data across all connections—they are not associated with specific connections.
To show or refresh the graphs, go to the Connections tab and click the Reload button  in the upper toolbar.
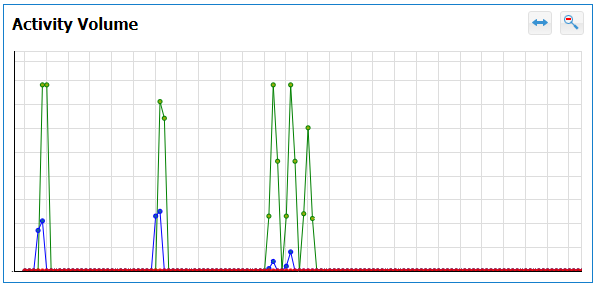
Activity Volume graph
Displays activity across all connections.
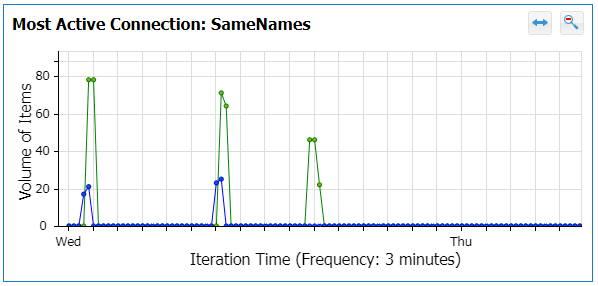
Most Active Connection graph
Displays the connection that has the most activity.
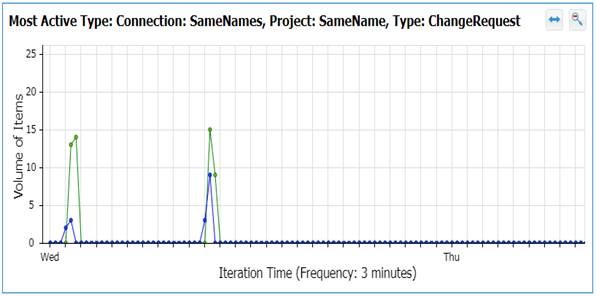
Most Active Type graph
Displays the type that has the most activity.