Share this page


Charts
Micro Focus Connect charts show information relating to the activity in your environment, as a function of the iteration time.
In this topic:
Chart types
Micro Focus Connect provides two types of charts:
- Quick Glance charts. Graphs describing activity on your Micro Focus Connect machine. For details, see Quick glance charts.
- Connection charts. Graphs describing activity within a specific connection. For details, see Connection charts.

Chart legend
The line colors in the charts indicate different measurements.
| Line color | Title | Indicates … |
|---|---|---|
| Green | Volume | the number of items read. |
| Blue | Changes | the number of items modified. |
| Red | Errors | the number of failed changes. |
Data point information
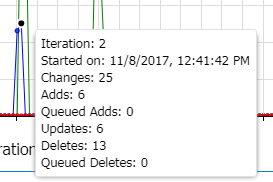
To view detailed information, hover over a data point.
The popup shows the iteration number and a time stamp, along with the chart-specific information.
Manipulate a chart
This section describes how to manipulate charts to view the desired information effectively.
-
Zoom and Pan.
 /
/
Pan/Zoom 
Unzoom

Load chart (Project Changes chart only)

Clear selections
(Project Changes chart only) - Resize the chart pane. Drag the window border to the desired size. (Quick Glance charts only)
- Hide the chart pane. Click the left facing arrow to collapse the view. (Quick Glance charts only)
 See also: