Summary reports
The Analysis Summary Report provides general information about the execution of the load test scenario. It lists statistics about the scenario run and provides links to the following graphs: Running Vusers, Throughput, Hits Per Second, HTTP Responses per Second, Transaction Summary, and Average Transaction Response Time.
| To access |
Session Explorer > Reports > Summary Report |
| Important information |
The Summary report for Diagnostics provides a usage chart that links to and displays each individual transaction's web, application, and database layers, and provides the total usage time for each transaction. |
| Relevant tasks |
You can save the Summary Report to an Excel file by selecting View > Export Summary to Excel or by clicking
|
 on the toolbar.
Summary report
User interface elements are described below:
|
UI Element |
Description |
|---|---|
| Scenario details |
This section shows the basic details of the load test scenario being analyzed. |
| Scenario Schedule |
This graph shows the schedule of the Controller scenario. You can use this information to identify problems. For example, if the maximum number of users in your scenario exceeds your licenses, you will see a gap between the number of users in this schedule graph and the actual number of users that ran the scenario. |
| Statistics |
This section shows a breakdown of the transaction statistics, and status for SLAs defined for each measurement. Click on a measurement to open the relevant graph for the measurement. |
| Top Transactions by Duration |
This table shows the five transactions with the highest average response time. |
| Scenario Behavior Over Time |
This section shows how each transaction performed in terms of the SLA over time intervals. The green squares show time intervals where the transaction performed within the SLA boundary. Red squares show time intervals where the transaction failed and gray squares show where no relevant SLA was defined. Note: The time intervals displayed in the Scenario Behavior Over Time section may vary for each interval. The time interval set in the tracking period of the SLA is only the minimum time interval that will be displayed. It is only the display that varies. The SLA is still determined over the time interval you choose in the Advanced Settings section. Analysis allows you to analyze a specific transaction in more detail. You open the Analyze Transaction tool from the Scenario Behavior Over Time section in one of the following ways:
For more information on Transaction Analysis Reports, see Analyze Transactions dialog box. |
| Transactions |
This section displays a table containing the load test scenario's diagnostics data. Using the table header bar you can filter by SLA status, search for transactions or values in the table, and filter columns by clicking on the column title. At the end of the table you can scroll between pages. This table includes the following:
|
| HTTP Responses |
This section shows the number of HTTP status codes returned from the web server during the load test scenario, grouped by status code. Note: There are additional Diagnostics sections that may appear at the end of the Summary report, depending on the configuration of your system. |

Summary report with SLA
This table describes the elements of the report indicating SLA compliance.
Note: This feature is available for version 2020 SP3 and later.
|
Name |
Description |
|---|---|
| Scenario details |
Basic details of the load test scenario being analyzed. |
| Statistics Summary |
A breakdown of the transaction statistics. |
| X Worst Transactions/ SLA Violations |
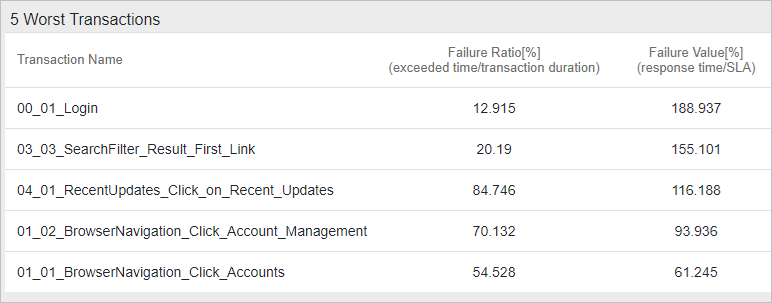
The worst transactions in terms of how often the transactions exceeded the SLA boundary during the run, and by how much. Transaction Response Time (Average) This section shows:
The following example shows the 5 transactions with the worst average response time.
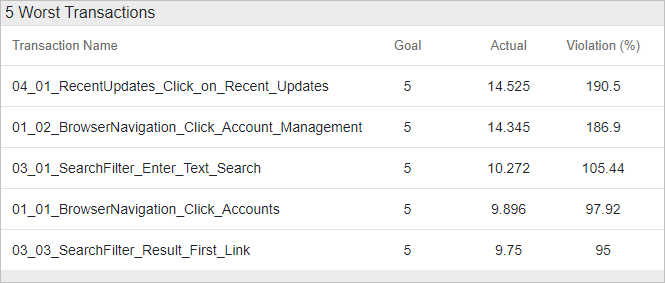
Transaction Response Time (Percentile) This section shows an SLA violation report with the following information:
In the following example, in the first transaction, the Goal value of 5 was exceeded on average by 190.5%.
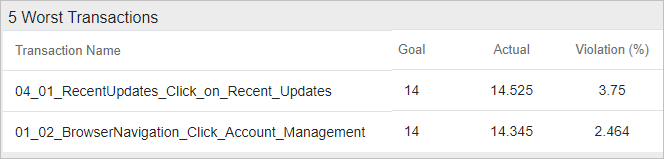
The table will only display transactions that have exceeded the threshold. If we would change the goal to 14, only two transactions would be marked as 'Failed' and only those two would be shown.
|
Summary reports for cross result graphs
User interface elements are described below:
|
UI Element |
Description |
|---|---|
| <graphs> |
Displays summary information for the scenarios that you are comparing. The information is displayed in a way that enables you to compare data from the different scenarios. Includes the same type of information as the regular Summary report except for the following:
|
 See also: