Results overview
To monitor the scenario performance during test execution, use the online monitoring tools described in Monitor load test scenarios.
To view a summary of the results after test execution, use one or more of the following tools:
-
Vuser log files. These files contain a full trace of the load test scenario run for each Vuser. These files are located in the scenario results folder. (When you run a Vuser script in standalone mode, these files are stored in the Vuser script folder.)
-
Controller Output window. The output window displays information about the load test scenario run. If your scenario run fails, look for debug information in this window.
-
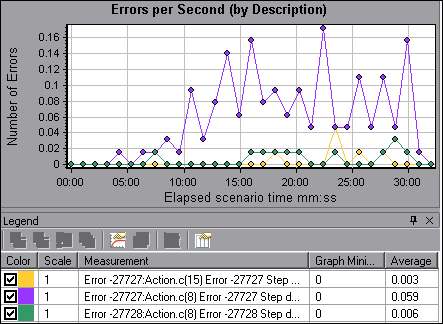
Analysis Graphs. Standard and protocol-specific graphs help you determine system performance and provide information about transactions and Vusers.
- You can compare multiple graphs by combining results from several load test scenarios or merging several graphs into one.
- Each graph has a legend which describes the metrics in the graph. You can also filter your data and sort it by a specific field.

-
Analysis Graph Data and Raw Data Views. These views display the actual data used to generate the graph in a spreadsheet format. You can copy this data into external spreadsheet applications for further processing.
-
Analysis Reports. This utility enables you to generate a summary of each graph. The report summarizes and displays the test's significant data in graphical and tabular format. You can generate reports based on customizable report templates.


