Share this page


Azure Insights monitor
Microsoft Azure Monitor provides availability and performance monitoring for web applications. LoadRunner Professional's integration with Azure Monitor enables the collection of telemetry data via the Azure Application Insights service.
The LoadRunner Azure Insights monitor collects the resource metrics from Azure Application Insights, and displays the applicable measurements in the Controller's Azure Insights graph. The monitor can measure every resource from Azure that has metrics.
Set up Azure Application Insights monitoring
When configuring the Azure Insights monitor, you need your account authentication details for connecting to the Azure Metrics portal.
To set up the Azure Insights monitor:
-
In Controller, on the Run tab, select Graphs > Microsoft Azure > Azure Insights .
The Azure Insights graph opens in the display area.
-
In the Azure Insights graph display box, click Add measurements.
-
In the displayed Azure Insights Metrics dialog box > Monitored Server Machines pane, click Add. The Add New Resource dialog box opens.
-
On the Authentication tab, enter the required authentication details to connect to the Application Insights API, and click Connect.
-
When successfully connected to the API, the Resources Selection tab is displayed, populated with the resource groups from the Azure console that are relevant for the entered credentials.
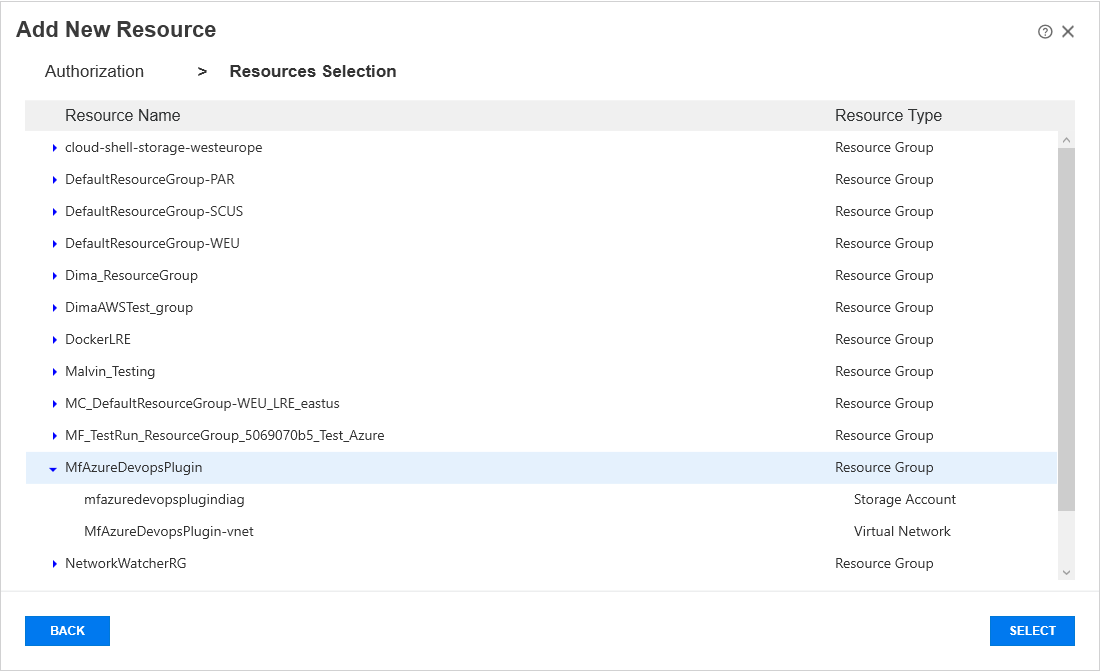
Note: The display order of the resource groups may differ from the console.
Expand a group (resource groups that cannot be expanded are empty) and select the required resource, then click Select.
-
The selected resource is displayed in the Azure Insights dialog box. Repeat the process to add additional resources.
-
In the Azure Insights dialog box, select a listed resource. In the Resource Measurements area, click Add.
-
The displayed Add Measurements dialog box lists the available measurements for the resource (the measurements are different for each resource type). Add the measurements you want to include to the Selected measurements list, then click OK.
The measurements are displayed in the Resource Measurements pane of the Azure Insights dialog box.
-
Repeat steps 7 & 8 to add measurements for each listed resource.
-
When done, click OK in the Azure Insights dialog box.
-
(Recommended) In the Azure Insights graph settings, set Graph Time to Last 3600 sec.
-
After some brief processing, Controller displays metrics in the Azure Insights graph.

 See also: