Drill down in a graph
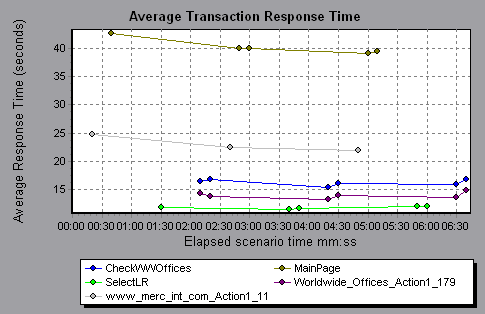
Drill down enables you to focus on a specific measurement within your graph and display it according to a preferred grouping. The available groupings depend on the graph. For example, the Average Transaction Response Time graph shows one line per transaction. To determine the response time for each Vuser, you drill down on one transaction and sort it according to Vuser ID. The graph displays a separate line for each Vuser's transaction response time.
Note: The drill down feature is not available for the Web Page Diagnostics graph.
The following graph shows a line for each of five transactions.

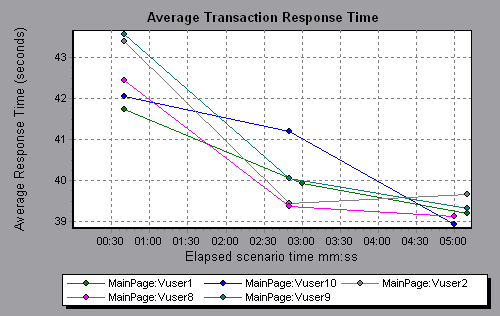
When you drill down on the MainPage transaction, grouped by Vuser ID, the graph displays the response time only for the MainPage transaction, one line per Vuser.

You can see from the graph that the response time was longer for some Vusers than for others.
To determine the response time for each host, you drill down on one transaction and sort it according to host. The graph displays a separate line for the transaction response time on each host. For more information on drilling down in a graph, see Get more information from graph data.


