Cross Result graphs overview
Cross Result graphs are useful for:
-
Benchmarking hardware
-
Testing software versions
-
Determining system capacity
If you want to benchmark two hardware configurations, you run the same load test scenario with both configurations and compare the transaction response times using a single Cross Result graph.
Suppose that your vendor claims that a new software version is optimized to run quicker than a previous version. You can verify this claim by running the same scenario on both versions of the software, and comparing the scenario results.
You can also use Cross Result graphs to determine your system's capacity. You run scenarios using different numbers of Vusers running the same script. By analyzing Cross Result graphs, you can determine the number of users that cause unacceptable response times.
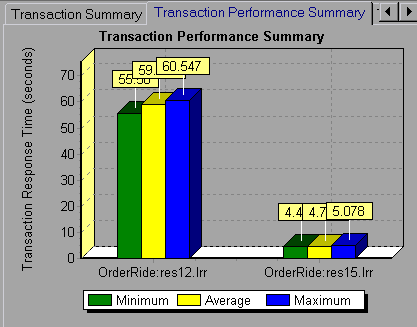
In the following example, two scenario runs are compared by crossing their results, res12, and res15. The same script was executed twice—first with 100 Vusers and then with 50 Vusers.
In the first run, the average transaction time was approximately 59 seconds. In the second run, the average time was 4.7 seconds. It is apparent that the system works much slower with a greater load.
The Cross Result graphs have an additional filter and group by category: Result Name. The example below is filtered to the OrderRide transaction for results res12, and res15, grouped by Result Name.


