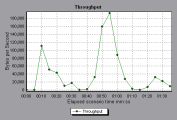
Throughput graph
This graph shows the amount of throughput on the server during each second of the load test scenario run. Throughput is measured in bytes or megabytes and represents the amount of data that the Vusers received from the server at any given second. To view throughput in megabytes, use the Throughput (MB) graph.
| Purpose |
Helps you evaluate the amount of load that Vusers generate, in terms of server throughput. |
| X-axis |
Elapsed time since the start of the scenario run. |
| Y-axis |
Throughput of the server, in bytes or megabytes. |
| Tips |
Compare to the Average Transaction Response Time graph to see how the throughput affects transaction performance. |
| Note |
You cannot change the granularity of the x-axis to a value that is less than the web granularity you defined in the General tab of the Options dialog box. |
| See also |
Example
In the following example, the highest throughput is 193,242 bytes during the fifty-fifth second of the scenario.


