This topic looks at the User-Defined Data Points graphs in Analysis.
Overview
The User-Defined Data Points graphs display the values of user-defined data points. You define a data point in your Vuser script by inserting an lr_user_data_point function at the appropriate place (user_data_point for GUI Vusers and lr.user_data_point for Java Vusers).
Action1()
{
    lr_think_time(1);
    lr_user_data_point ("data_point_1",1);
    lr_user_data_point ("data_point_2",2);
    return 0;
}
For Vuser protocols that support the graphical script representations, such as Web and Oracle NCA, you insert a data point as a User-Defined step. Data point information is gathered each time the script executes the function or step. For more information about data points, refer to the Function Reference.
Data points, like other Analysis data, are aggregated every few seconds, resulting in less data points shown on the graph than actually recorded. For more information, see Change the granularity of the data.
Data Points (Sum) graph
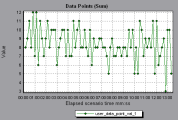
This graph shows the sum of the values for user-defined data points throughout the load test scenario run.
This graph typically indicates the total amount of measurements which all Vusers are able to generate. For example, suppose only a certain set of circumstances allow a Vuser to call a server. Each time it does, a data point is recorded. In this case, the Sum graph displays the total number of times that Vusers call the function.
| X-axis | Elapsed time since the start of the run. |
| Y-axis | The sum of the recorded data point values. |
In the following example, the call to the server is recorded as the data point user_data_point_val_1. It is shown as a function of the elapsed scenario time.
Data Points (Average) graph
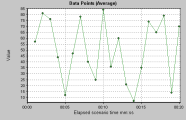
This graph shows the average measurement values that were recorded for user-defined data points during the load test scenario run.
Suppose that each Vuser monitors CPU utilization on its machine and records it as a data point. In this case, the actual recorded value of CPU utilization is required.
| X-axis | Elapsed time since the start of the run. |
| Y-axis | The average values of the recorded data point statements. |
In the following example, the CPU utilization is recorded as the data point user_data_point_val_1. It is shown as a function of the elapsed scenario time.
 See also:


