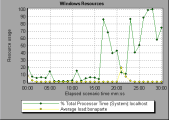
Server Resources graph
This graph shows the resources (CPU, disk space, memory, or services) used on remote UNIX servers measured during the load test scenario.
| Purpose |
This graph helps you determine the impact of Vuser load on the various system resources. |
| X-axis |
Elapsed time since the start of the run. |
| Y-axis |
The usage of resources on the UNIX server. |
| See also |
Example
In the following example, Windows resource utilization is measured during the load test scenario. It is shown as a function of the elapsed scenario time.


