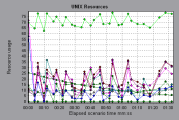
UNIX Resources graph
This graph shows the UNIX resources measured during the load test scenario. The UNIX measurements include: average load, collision rate, context switch rate, CPU utilization, incoming packets error rate, incoming packets rate, interrupt rate, outgoing packets error rate, outgoing packets rate, page-in rate, page-out rate, paging rate, swap-in rate, swap-out rate, system mode CPU utilization, and user mode CPU utilization.
| Purpose |
This graph helps you determine the impact of Vuser load on the various system resources. |
| X-axis |
Elapsed time since the start of the run. |
| Y-axis |
The usage of resources on the UNIX machine. |
| Note |
To obtain data for this graph, you need to select the measurements for the online monitor (from Controller) before running the scenario. |
| See also |
Example
In the following example UNIX resources are measured during the load test scenario.


