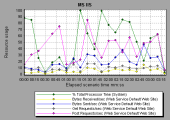
Microsoft Information Internet Server (IIS) graph
This graph shows server statistics as a function of the elapsed load test scenario time.
| X-axis |
Elapsed time since the start of the run. |
| Y-axis |
The resource usage on the MS IIS. |
| Note |
To obtain data for this graph, you need to enable the MS IIS online monitor (from Controller) and select the default measurements you want to display, before running the scenario. |
| See also |
Example
In the following example the Bytes Received/sec and Get Requests/sec measurements remained fairly steady throughout the scenario, while the % Total Processor Time, Bytes Sent/sec, and Post Requests/sec measurements fluctuated considerably.
The scale factor for the Bytes Sent/sec and Bytes Received/sec measurements is 1/100, and the scale factor for the Post Requests/sec measurement is 10.


