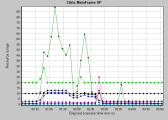
Citrix Server graph
This graph is an Application Deployment solution which delivers applications across networks. The Citrix Server monitor is an Application Deployment Solution monitor, which provides performance information for the Citrix server.
| X-axis |
Elapsed time since the start of the run. |
| Y-axis |
The resource usage on the Citrix server. |
| Note |
To obtain data for this graph, you need to enable the Citrix Server monitor (from Controller) and select the default measurements you want to display, before running the scenario. |
| See also |


