HTML reports
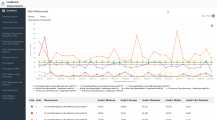
Analysis enables you to create HTML reports for your load test scenario run. It creates a separate page for each one of the open graphs and reports.
| To access |
Use one of the following:
|
| Relevant tasks |
|
User interface elements are described below:
| UI Element | Description |
|---|---|
| <Graphs> menu left frame |
Click the graph link to view an HTML report for that graph. |
|
|
You can view an Excel file containing the graph data, by clicking the Open in Excel button on the relevant graph page. |

|
Context Menu. Right-click to print the graph, or save it as an image (.png, .jpeg, or .svg) or PDF. |
| Graph pane | Hover over the graph to view details of the displayed measurements. |
| Legend | Click a measurement on the legend to show or hide it from the graph. |


