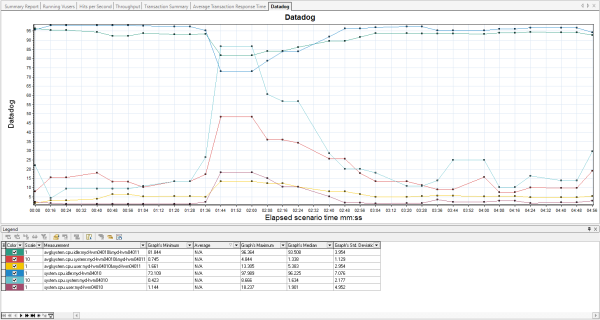
Datadog graph
The Analysis Datadog graph displays metrics fetched by the Datadog monitor. For details, see Datadog monitor.
When a metric is showing aggregated results from more than one host, the names of all hosts are included in the Measurement column in the legend. The aggregation method is indicated in the metric name, for example, avg:metric1.
| X-axis |
Elapsed time since the start of the run. |
| Y-axis |
Dependent on the selected Datadog metrics. |
 See also:


