Share this page


Network delay monitoring
This topic introduces network monitoring and the Network Delay Time monitor.
Network monitoring overview
Network configuration is a primary factor in the performance of applications. A poorly designed network can slow client activity to unacceptable levels.
You use network monitoring to determine whether your network is causing a delay in the scenario. You can also determine the problematic network segment.
In a true web or client/server system, there are many network segments. A single network segment with poor performance can affect the entire system.
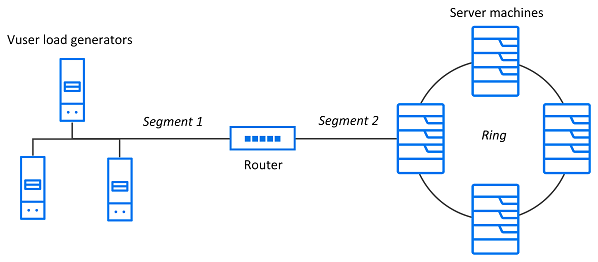
The following diagram shows a typical network. To go from the server machine to the Vuser machine, data must travel over several segments.

Network Delay Time monitor
The Network Delay Time monitor measures the delays for the complete path between the source and destination machines (for example the database server and Vuser host).
To measure network performance, the Network Delay Time monitor sends packets of data across the network. When a packet returns, the monitor calculates the time it takes for the packet to go to the requested node and return. This time is the delay which appears in the Network Delay Time graph.
Note: The delays from the source machine to each of the nodes are measured concurrently, yet independently. It is therefore possible that the delay from the source machine to one of the nodes could be greater than the delay for the complete path between the source and destination machines.
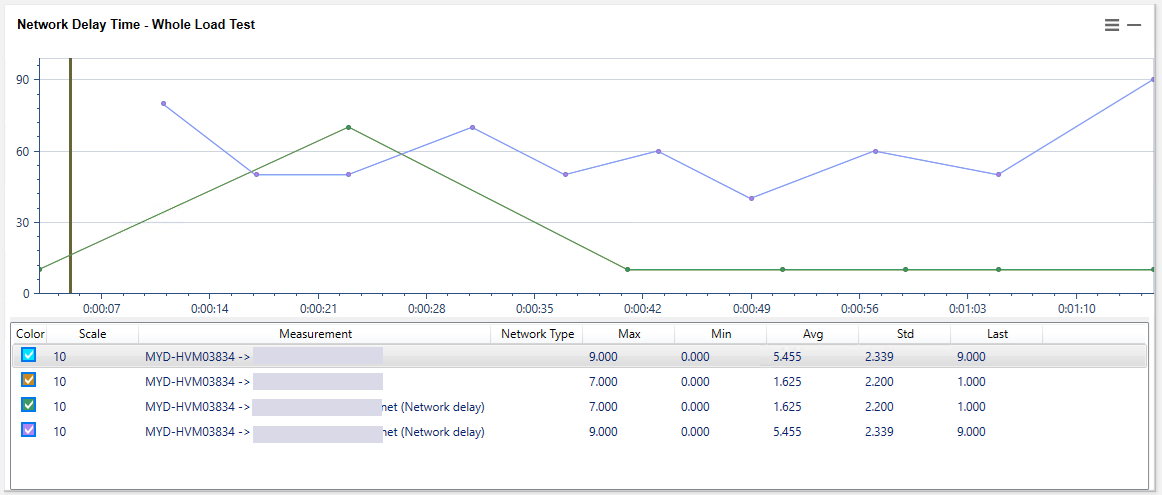
Network Delay Time graph
The Network Delay Time graph shows the delay for the complete path between the source and destination machines (y-axis) as a function of the elapsed scenario time (x-axis).
Each path defined in the Add Destination Machines for Network Delay Monitoring dialog box is represented by a separate line with a different color in the graph.
 See also: