Share this page


Integration with CloudWatch
You can configure Controller to push real-time metrics from scenario runs to the AWS CloudWatch platform.
Version support: The CloudWatch integration is available from version 24.3.
About the CloudWatch integration
Amazon CloudWatch is a monitoring service for AWS resources and applications.
To set up the integration, you configure the connection to the AWS server. This only needs to be done once, and the data is then pushed to CloudWatch each time you run a scenario in Controller.
In CloudWatch, you view the published metrics in a dedicated namespace. There is a few minutes delay between the data timestamps from Controller, and when they are actually displayed in CloudWatch.

Set up the integration with CloudWatch
You define the integration details in Controller.
The integration requires authentication credentials for an AWS account. For details on generating the authentication keys, see the AWS documentation.
To configure Controller to push data to CloudWatch:
- In the Controller toolbar, select Tools > CloudWatch Configuration. The AWS CloudWatch Configuration dialog box opens.
- In the Region field, select the AWS region where you want to send the data.
- In the Access key and Secret key fields, enter your AWS credentials.
- Click Test Connection. If connected, a Connection successful message is displayed.
- Click OK.
-
When you run a Controller scenario, the data is displayed in the CloudWatch metrics dashboard (after a short delay). For details, see Publishing metrics to CloudWatch.
To block Controller from pushing data to CloudWatch
-
Select Tools > CloudWatch Configuration.
-
In the AWS CloudWatch Configuration dialog box, click Clear.
-
Click OK.
Publishing metrics to CloudWatch
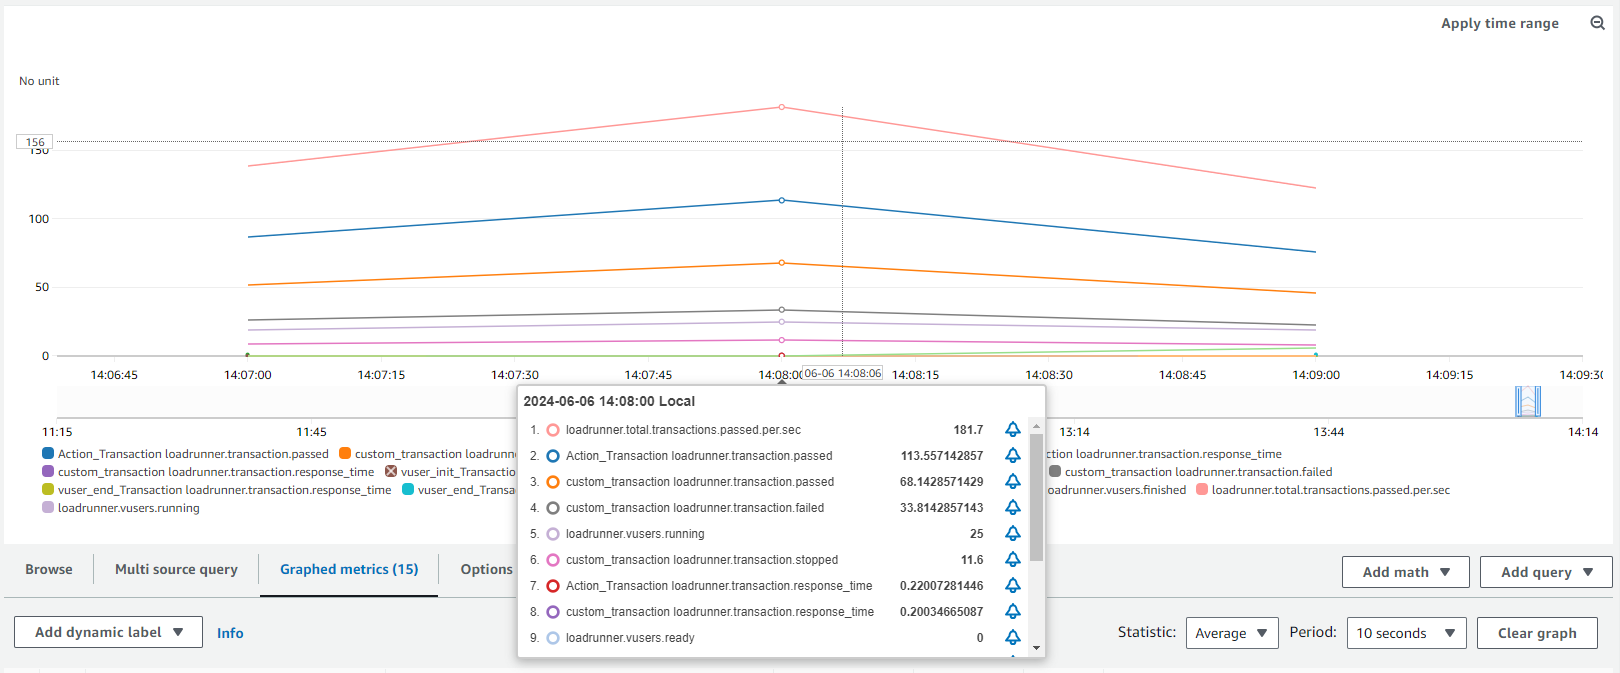
To view the data, you log into your AWS account and check the Metrics section for the CloudWatch service. When you start running a scenario, the incoming metrics are published in a custom namespace named LoadRunner Professional.
The metrics are published in columns and graphs that can be filtered from the Info area. For a list of metric names used in CloudWatch, see CloudWatch metrics
The metrics have the same values as in Controller, but are aggregated in CloudWatch to a minimum granularity of 60 seconds. If you select a time period in the Period field that is greater than 1 minute, CloudWatch automatically aggregates the data to your selection. For example, if the period is 5 minutes, an aggregated data point is added to the graph every 5 minutes.
Hover over a metric name in the legend to view the Controller host that sent the data, and other information.
CloudWatch metrics
The scenario run information from LoadRunner Professional is divided into metrics, with names that begin with loadrunner.
Available metrics include the following:
| Metric | Details |
|---|---|
| loadrunner.vusers.running | Number of Vusers currently running. |
| loadrunner.vusers.ready | Number of Vusers ready to run. |
| loadrunner.vusers.finished | Number of Vusers that have finished running. |
| loadrunner.vusers.error | Number of Vusers that have failed with errors. |
| loadrunner.total.transactions.passed.per.sec | Total transactions passed per second. |
| loadrunner.transaction.response_time | Specific transaction response time. |
| loadrunner.transaction.passed | Number of successful executions of the transaction. |
| loadrunner.transaction.failed | Number of failed executions of the transaction. |
| loadrunner.transaction.stopped | Number of stopped executions of the transaction. |
 See also: