Auto-correlation of measurements
You can detect similar trends among measurements by correlating a measurement in one graph with measurements in other graphs. Correlation cancels the measurements' actual values and allows you to focus on the behavior pattern of the measurements during a specified time range of the load test scenario.
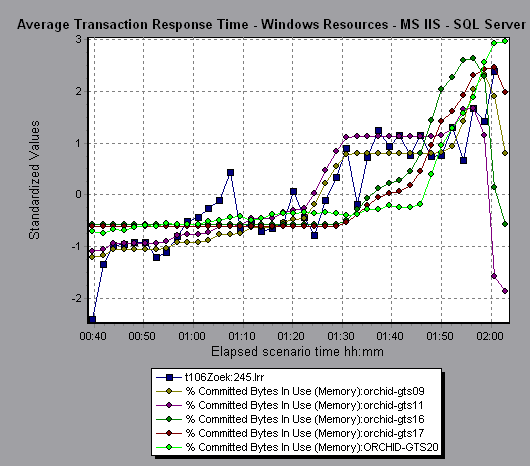
In the following example, the t106Zoek:245.lrr measurement in the Average Transaction Response Time graph is correlated with the measurements in the Windows Resources, Microsoft IIS, and SQL Server graphs. The five measurements most closely correlated with t106Zoek:245.lrr are displayed in the graph below.

Note: This feature can be applied to all line graphs except the Web Page Diagnostics graph.


