Share this page


This topic provides an overview of the Web Page diagnostic graphs.
Tree view
The Web Page Diagnostics tree view displays a tree view of the transactions, sub-transactions, and web pages for which you can view Web Page Diagnostics graphs. For details, see Web Page Diagnostics graph.
The Web Page Diagnostics graphs enable you to assess whether transaction response times were affected by page content. Using the Web Page Diagnostics graphs, you can analyze problematic elements—for example, images that download slowly, or broken links—of a website.

Graphs overview
Web Page Diagnostics graphs provide you with performance information for each monitored web page in your script. You can view the download time of each page in the script and its components, and identify at what point during download time problems occurred. In addition, you can view the relative download time and size of each page and its components. Analysis displays both average download time and download time over time data.
You correlate the data in the Web Page Diagnostics graphs with data in the Transaction Performance Summary and Average Transaction Response Time graphs in order to analyze why and where problems are occurring, and whether the problems are network- or server-related.
The following diagram illustrates the sequence of events from the time an HTTP request is sent:
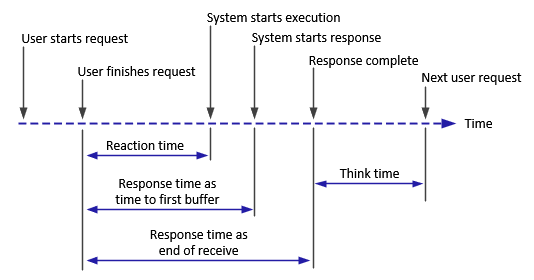
Note: Because server time is being measured from the client, network time may influence this measurement if there is a change in network performance from the time the initial HTTP request is sent until the time the first buffer is sent. The server time displayed, therefore, is estimated server time and may be slightly inaccurate.
You begin analyzing the Transaction Performance Summary and Average Transaction Response Time graphs with the Web Page Diagnostics graph, which displays the average download time (in seconds) for each monitored web page during each second of the load test scenario run. The x-axis represents the elapsed time from the beginning of the scenario run. The y-axis represents the average download time (in seconds) for each web page.
These graphs can also be used for analyzing mobile applications using the Mobile Application - HTTP/HTML protocol.
In order for Analysis to generate Web Page Diagnostics graphs, you must enable the Web Page Diagnostics feature in Controller before running your scenario.
- In Controller, from the menu, choose Diagnostics > Configuration and select the Enable the following diagnostics check box.
- In the Offline Diagnostics section, if the button to the right of Web Page Diagnostics (Max. Vuser Sampling: 10%) says Enable, click it.
Note: When preparing a Web HTTP/HTML Vuser script for which you want to perform web diagnostics, it is recommended that you create an HTML-based script (using the Recording tab in the Recording Options).
 See also:
Transaction breakdowns
The Web Page Diagnostics graphs are most commonly used to analyze a problem detected in the Transaction Performance Summary or Average Transaction Response Time graphs. For example, the Average Transaction Response Time graph below demonstrates that the average transaction response time for one of the transactions was high.
Using the Web Page Diagnostics graphs, you can pinpoint the cause of the delay in response time for the problematic transaction.
This task describes how to breakdown a transaction.
-
Right-click trans1 and select Web Page Diagnostics for trans1. The Web Page Diagnostics graph opens and the Web Page Diagnostics tree appear. An icon appears next to the page name indicating the page content. See Content icons.
-
In the Web Page Diagnostics tree, right-click the problematic page you want to break down, and select Break Down <component name>. Alternatively, select a page in the Select Page to Break Down box that appears under the Web Page Diagnostics graph. The Web Page Diagnostics graph for that page appears.
-
Select one of the following available breakdown options:
-
Download Time. Displays a table with a breakdown of the selected page's download time. The size of each page component (including the component's header) is displayed. For details, see the Page Download Time Breakdown graph.
-
Component (Over Time). Displays the Page Component Breakdown (Over Time) graph for the selected web page.
-
Download Time (Over Time). Displays the Page Download Time Breakdown (Over Time) graph.for the selected web page.
-
Time to First Buffer (Over Time). Displays the Time to First Buffer Breakdown (Over Time) graph for the selected web page.
Note: You can open a browser displaying the problematic page by right-clicking the page in the Web Page Diagnostics tree and selecting View page in browser.
You can also access these graphs, along with other Diagnostics graphs, from the Open a New Graph dialog box (Graph > Add New Graph).
Content icons
The following icons appear in the Web Page Diagnostics tree. They indicate the HTTP content of the page.
| Name | Description |
|---|---|
|
|
Transaction. Specifies that the visible content is part of the transaction. |
|
|
Page Content. Specifies that the visible content, including elements such as text and images, is all part of one logical page. |
|
|
Text content. Textual information. Plain text is intended to be displayed as-is. Includes HTML text and style sheets. |
|
|
Multipart content. Data consisting of multiple entities of independent data types. |
|
|
Message content. An encapsulated message. Common subtypes are news, or external-body which specifies large bodies by reference to an external data source. |
|
|
Application content. Some other kind of data, typically either uninterpreted binary data or information to be processed by an application. An example subtype is Postscript data. |
|
|
Image content. Image data. Two common subtypes are the jpeg and gif format. |
|
|
Resource content. Other resources not listed above. Also, content that is defined as "not available" is likewise included. |


See also: