Share this page


The Network Monitor graphs help you monitor the network and determine if the network is causing a bottleneck. If the problem is network-related, you can locate the problematic segment or sub-path that should be fixed.
Network Monitor graphs overview
Network configuration is a primary factor in the performance of applications and web systems. A poorly designed network can slow client activity to unacceptable levels. In an application, there are many network segments. A single network segment with poor performance can affect the entire application.
The following diagram shows a typical network. To go from the server machine to the Vuser machine, data must travel over several segments.
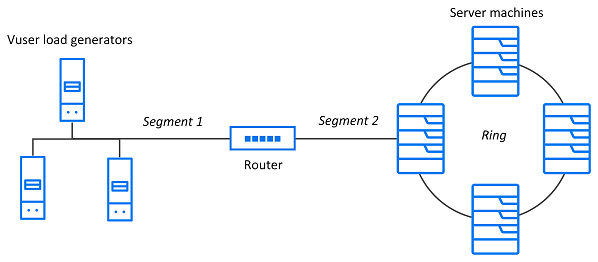
To measure network performance, the network monitor sends packets of data across the network. When a packet returns, the monitor calculates the time it takes for the packet to go to the requested node and return.
A node is an object of interest in your network. Each segment between two nodes defines a link. This is how your network defines the relationships between the nodes in it. A path is an alternating sequence of nodes and links that starts and ends with nodes. No node or link appears more than once. A sub-path is created when a network analysis operation or a user explicitly creates a link index at a point along that path.
Network monitor Analysis activation
In order for Analysis to generate Network monitor graphs, you must activate the network monitor before executing the load test scenario. In the Network monitor settings, specify the path you want to monitor. For information about setting up the network monitor, see Network delay monitoring.

Network Delay Time graph
The Network Delay Time graph shows the delays for the complete path between the source and destination machines (for example, the database server and Vuser load generator). It maps the delay as a function of the elapsed load test scenario time.
Each path defined in Controller is represented by a separate line with a different color in the graph.
Tip: You can merge various graphs to determine if the network is a bottleneck. For example, using the Network Delay Time and Running Vusers graphs, you can determine how the number of Vusers affects the network delay.
| Axis | Description |
|---|---|
| X-axis | Elapsed time since the start of the run. |
| Y-axis | Network delay time. |
In the following example of a merged graph, the network delays are compared to the running Vusers. The graph shows that when all 10 Vusers were running, a network delay of 22 milliseconds occurred, implying that the network may have been overloaded.

Network Sub-Path Time graph
This graph shows the delay (in milliseconds) from the source machine to each node from one sub-path/link index to the next, along the path according to the elapsed load test scenario time. Each sub-path is displayed as a separate line with a different color.
Note: The delays from the source machine to each of the nodes are measured concurrently, yet independently. Therefore, the delay from the source machine to one of the nodes could be greater than the delay for the complete path between the source and destination machines.
| Axis | Description |
|---|---|
| X-axis | Elapsed time since the start of the run. |
| Y-axis | Network delay time. |
In the following example, four sub-paths are shown. The graph indicates that one sub-path caused a delay of 70 milliseconds in the sixth minute.

Network Segment Delay Time graph
The Network Segment Delay Time graph shows the delay (in seconds) for each segment of the path according to the elapsed load test scenario time. Each segment is displayed as a separate line with a different color.
Note: The segment delays are measured approximately, and do not add up to the network path delay, which is measured exactly. The delay for each segment of the path is estimated by calculating the delay from the source machine to one node and subtracting the delay from the source machine to another node. For example, the delay for segment B to C is calculated by measuring the delay from the source machine to point C, and subtracting the delay from the source machine to point B.
| Axis | Description |
|---|---|
| X-axis | Elapsed time since the start of the run. |
| Y-axis | Network delay time. |
In the following example, four segments are shown. The graph indicates that one segment caused a delay of 70 seconds in the sixth minute.

 See also: