TruClient Native Mobile graphs
TruClient is a browser-based tool for creating scripts that can be used in load testing or monitoring web and mobile applications.
Using Analysis, you can display and analyze the TruClient - Native Mobile graphs. These graphs display the app-related measurements that are produced while using the TruClient technology to record user activity in native or hybrid mobile apps.
TruClient CPU Utilization Percentage graph
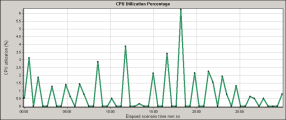
The TruClient CPU Utilization Percentage graph displays the percentage of the CPU utilized by an application, during the test run, for TruClientNative Mobile Vuser scripts. It helps you to evaluate the amount of CPU utilized by an application.
| Axis | Description |
|---|---|
| X-axis | Elapsed time since the start of the scenario run. |
| Y-axis | The percentage of the CPU utilized during the test run. |
The following example shows that at 18 minutes into the test run, the CPU utilization peaked to approximately 6%.
TruClient Free Memory in Device graph
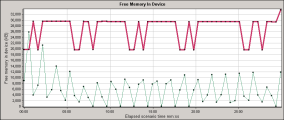
Th TruClient Free Memory in Device graph displays the free memory on the mobile device for TruClient Native Mobile scripts as a function of time. It helps you evaluate the amount of memory available on the device during the test run.
| Axis | Description |
|---|---|
| X-axis | Elapsed time since the start of the scenario run. |
| Y-axis | The amount of free memory in KBs. |
In the following graph, one of the transactions shows more than 33 MBs of free memory at 30 minutes into the test run.
TruClient Memory Consumed by the Application graph
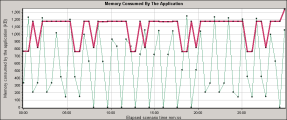
The TruClient Memory Consumed by the Application graph helps you evaluate the amount of memory consumed by the application as a function of time.
| Axis | Description |
|---|---|
| X-axis | Elapsed time since the start of the scenario run. |
| Y-axis | The memory consumed by the application in KBs. |
In the following graph, one of the transactions shows that memory consumption peaked to 1337 KBs at 30 minutes into the test.
 See also:


