Analysis user interface
This section describes the Analysis toolbars and Session Explorer, and customizing Analysis window layouts.
Analysis toolbars
The Analysis toolbars provide quick access to Analysis tools and functions.
Common toolbar
This toolbar is always accessible from the toolbar at top of the page and includes the following buttons:
User interface elements are described below:
| UI Element | Description |
|---|---|
|
|
Create a new session. |
|
|
Open an existing session. |
|
|
Generate a Cross Result graph. |
|
|
Save a session. |
|
|
Print item. |
|
|
Create an HTML report. |
|
|
View runtime settings. |
|
|
Set global filter options. |

|
Configure SLA rules |
|
|
Analyze a transaction. |
|
|
Undo the most recent action. |
|
|
Reapply the last action that was undone. |

|
Apply filter on summary page |

|
Export Summary to Excel |
Graph Toolbar
This toolbar is accessible from the top of the page when you have a graph open and includes the following buttons
User interface elements are described below:
| UI Element | Description |
|---|---|
|
|
Set filter settings. |
|
|
Clear filter settings. |
|
|
Set granularity settings. |
|
|
Merge graphs. |
|
|
Configure auto correlation settings. |
|
|
View raw data. |
|
|
Add comments to a graph. |
|
|
Add arrows to a graph. |
|
|
Set display options. |
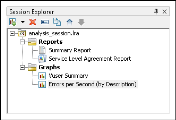
Session Explorer window
This window displays a tree view of the items (graphs and reports) that are open in the current session. When you click an item in the Session Explorer, it is activated in the main Analysis window.
| To access |
Use one of the following:
|
User interface elements are described below:
| UI Element | Description |
|---|---|
|
|
Add a new graph or report to the current Analysis session. Opens the Open a New Graph dialog box. For details, see Open a New Graph dialog box. |
|
|
Delete the selected graph or report. |
|
|
Rename the selected graph or report. |
|
|
Create a copy of the selected graph. |
Analysis window layouts
This section describes ways to customize the layout of the windows for the Analysis session.
Open windows
You can open a window or restore a window that was closed by selecting the name of the relevant window from the Windows menu.
Lock/unlock the layout of the screen
Select Windows > Layout Locked to lock or unlock the layout of the screen.
Restore the window placement to the default layout
Select Windows > Restore Default Layout to restore the placement of the Analysis windows to their default layout.
Note: This option is available only when there is no Analysis session open.
Restore the window placement to the classic layout
Select Windows > Restore Classic Layout to restore the placement of the Analysis windows to their classic layout. The classic layout resembles the layout of
Note: This option is available only when there is no Analysis session open.
Reposition and dock windows
You can reposition any window by dragging it to the desired position on the screen. You can dock a window by dragging the window and using the arrows of the guide diamond to dock the window in the desired position.
- Note:
-
Only document windows (graphs or reports) can be docked in the center portion of the screen.
-
Windows > Layout Locked must not be selected when repositioning or docking windows.
Using Auto Hide
You can use the Auto Hide feature to minimize open windows that are not in use. The window is minimized along the edges of the screen.
Click the Auto Hide button on the title bar of the window to enable or disable Auto Hide.


 > Analyze Transaction


