
Share this page


Prometheus monitor
The integration with Prometheus fetches data collected by Prometheus and displays it in Controller and Analysis.
Prometheus integration
Prometheus is a systems monitoring and alerting application that records real-time metrics in a time series database. Controller's Prometheus monitor fetches measurements from the Prometheus server and displays them during the scenario run in Controller's online Prometheus graph. For example, if you use Prometheus to monitor your load generator machine, you can select to display Prometheus measurements related to the load generator.
We recommend using the latest stable version of Prometheus.

Set up the Prometheus monitor
Set up the Prometheus monitor to collect data from the Prometheus server.
To set up the Prometheus monitor:
-
In Controller, in the Run tab, select Graphs > Prometheus Graphs > Prometheus. The Prometheus graph opens in the display area.
-
In the Prometheus graph display box, click Add measurements.
-
In the Prometheus dialog box, in the Monitored Server Machines area, click Add.
-
In the Host Selection dialog box, enter the following information.
Tip: You can save the information and credentials as a profile in the Monitor Credentials Manager, so that you can reuse it later. For details, see Monitor Credentials Manager.
To use a saved profile to connect, select Use profiles from Monitor Credentials Manager and choose the profile you want to use from the list.
- Enter the host URL and port number used to connect to the Prometheus server.
- If the Prometheus server uses an HTTP connection, clear the Use HTTPS checkbox.
-
Click Connect.
When you have successfully connected, the Resource Measurements area of the Prometheus dialog box becomes active.
-
In the Resource Measurements area, click Add.
-
In the Add Measurements dialog box, select the measurements to display in the graph. You can select measurements from the Available measurements list.
You can also add custom measurements based on parameters you define. For details, see Add custom measurements.
-
When done, click OK in the Add Measurements dialog box. The measurements are displayed in the Resource Measurements pane of the Prometheus dialog box.
-
Click OK in the Prometheus dialog box. When you run the scenario, the selected measurements are displayed in the graph.
Add custom measurements
You can add custom measurements to the Prometheus monitor by creating a custom Prometheus query that adds measurements based on parameters you define.
To add custom measurements:
-
Set up the Prometheus monitor. For details, see Set up the Prometheus monitor (steps 1-5).
-
In the Add Measurements dialog box, select a measurement from the Available measurements list to serve as the basis for your custom query. Make sure that only one measurement is selected.
-
Click Custom.
-
In the Customize query dialog box, enter your custom query. The query must be based on the selected measurement and must be written in PromQL, Prometheus's functional query language. For more information, refer to the Querying Prometheus section in the Prometheus product documentation.
Tip: To retrieve all possible metrics for a measurement, enter the measurement followed by empty curly brackets. For example: go_gc_duration_seconds{}
-
Click OK. All measurements that match the custom query are added to the Selected measurements list.
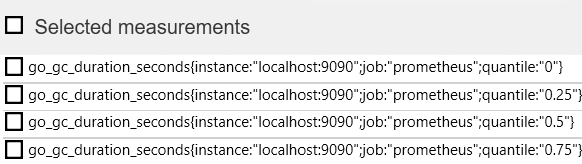
Example: The following custom query is based on the go_gc_duration_seconds measurement. Two parameters are added to the query. The first parameter restricts the query to the instance localhost:9090, and the second parameter instructs the query to find measurements in which quantile matches the regular expression "0.*".
go_gc_duration_seconds{instance="localhost:9090", quantile=~"0.*"}
When the above custom query is entered into the Customize query dialog box, all measurements that match the query are added to the Selected measurements list:
 See also:


