
Share this page


Usage analytics
Usage analytics provide you with general statistics about your Vuser usage and Controller scenario runs.
Usage analytics overview
Usage analytics provide you with general statistics about your Vuser usage and Controller scenario runs. This information can be useful for determining how your resources are being used and your license consumption. The analytics include:
- Summary graphs displaying the number of Vusers or runs per protocol.
- A bar chart showing run information such as the average run time and the total number of runs.
- A usage table with run information per protocol.
To access the analytics, open the License Utility and click the Usage Analytics button. For details, see License Utility.
The Usage Analytics report opens in a separate window. You can view the results in two pages: The Summary Report page and the Detailed View page.
Note: Statistics are only displayed for scenarios that ran for at least five minutes with 10 or more Vusers.

Summary Report page
The Summary Report page shows several pie charts and bar charts with basic information about your scenario runs.
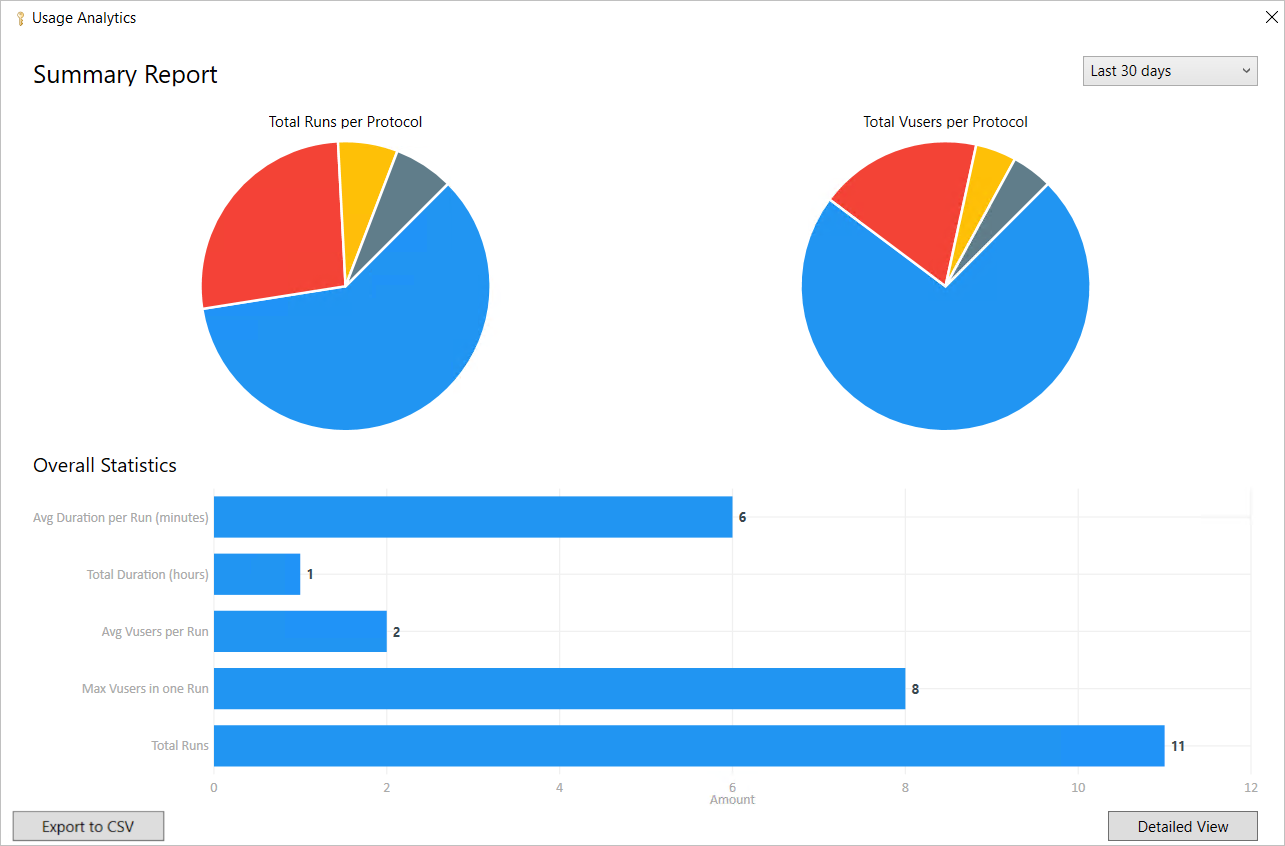
The Summary Report page shows two pie charts:
| Total Runs per Protocol | Number of runs per protocol |
| Total Vusers per Protocol | Number of Vusers that ran per protocol |
The Summary Report page's Overall Statistics section shows a bar chart with several metrics:
| Avg Duration per Run (min) | Average duration of a scenario run |
| Total Duration (hours) | Full duration of all runs, combined |
| Avg Vusers per Run | Average number of Vusers that ran for each scenario run |
| Max Vusers in one Run | Maximum number of Vusers that ran in a single scenario run |
| Total Runs | Total number of scenario runs |
To see more details, click Detailed View on the bottom right of the Summary Report page.
Filtering
Use the date picker in the top right corner to drill down into your results and filter the statistics by date. You can choose a predefined filter, such as Last 7 days, or provide a custom filter to show the range of dates that interests you.
Export to CSV
You can export your usage analytics data in CSV format. To export the data, click the Export to CSV button on the bottom left of the Summary Report page.
Detailed View page
To open the Detailed View page, click the button in the bottom right of the Summary Report window.
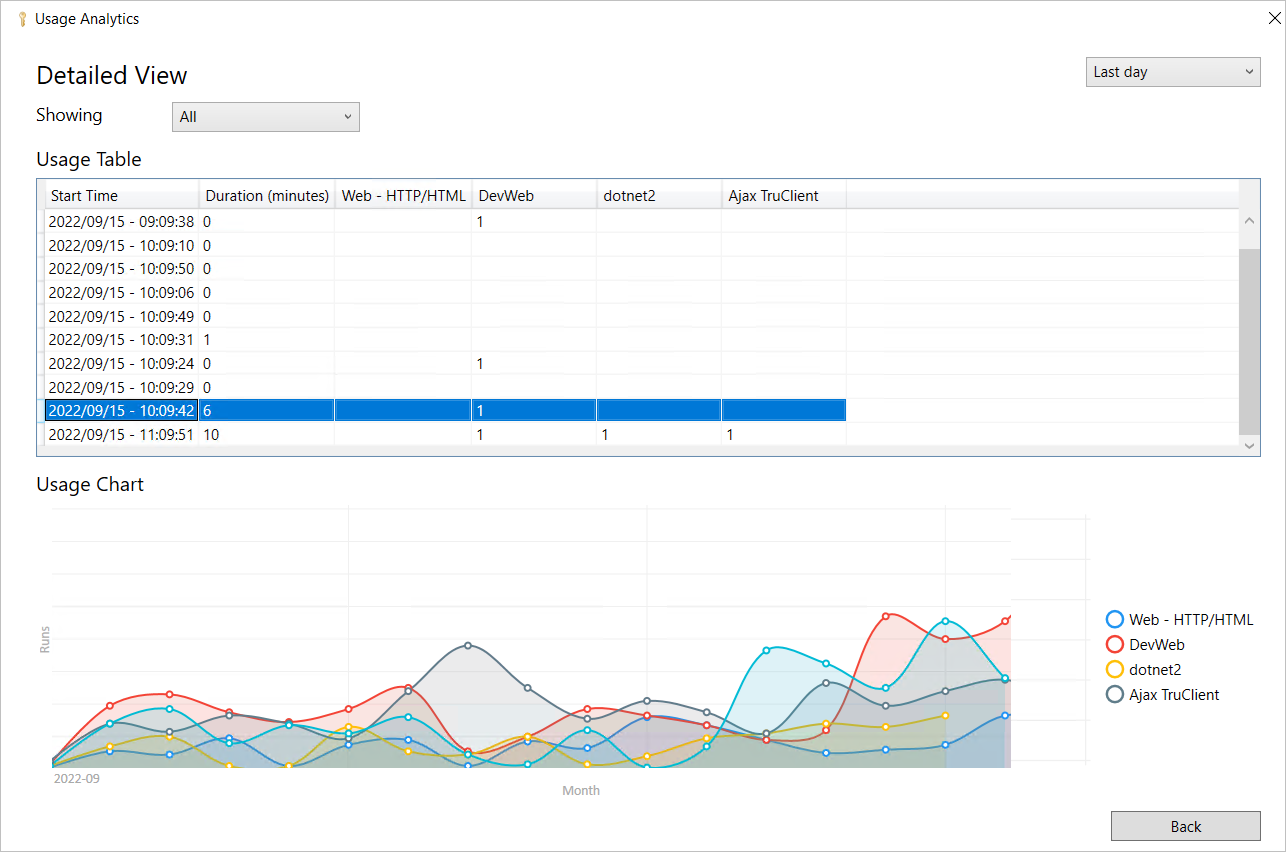
The Detailed View page shows a usage table and a summary graph.
The Usage table shows the following information about the scenario runs:
- Start Time
- Duration
- Number of Vusers per protocol
The Usage graph shows the amount of runs per protocol, over time.
Filtering
You can drill down in the detailed view by filtering the results by protocol or date.
To filter by date, use the date picker in the top right corner. If you applied a date filter in the Summary Report page, it is preserved.
To filter the results by protocol, use the protocol dropdown in the top left corner. The list is updated as you run additional scenarios. For example, if you run a JMeter test, it is automatically added to the dropdown list. To show all protocols, select All.
To return to the Summary Report page, click Back in the bottom right corner.
 See also:


