Share this page


Time series database streaming
This topic explains how to integrate an InfluxDB time series database (Beta) for a test run to stream raw and aggregated data.
Real-time streaming
Integration with a time series database enables you to stream aggregated or raw data and view testing metrics in real time.
Add a streaming data agent to the Assets area to integrate with the time series database. The agent enables communication with the database. You can then view the test's progress using a monitoring tool such as Grafana.
Currently, streaming raw data is supported only on cloud-based load generators and is limited to runs with a maximum of 5,000 concurrent Vusers.
Note: To use data streaming, submit a service request to enable data streaming for your tenant.
Install the streaming agent
Install the database and the streaming agent to integrate with InfluxDB. The agent connects your InfluxDB time series database to your tenant. Before you begin, download the InfluxDB database from the InfluxData downloads page and install it on your machine.
The following table lists the system requirements.
| Resource | Value |
|---|---|
| Supported OS | Windows 64-bit or Linux Docker |
| Supported InfluxDB versions |
1.8.x, 2.x |
Install and configure a Windows streaming agent
The following actions describe how to install and configure a Windows streaming agent.
| Action | Task |
|---|---|
|
Download and install the agent |
To download and install the agent:
|
|
Configure the agent |
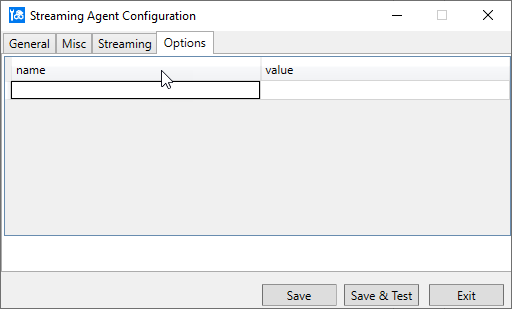
The Streaming Agent Configuration tool opens automatically after the agent installation. To run the configuration tool manually at any time, go to Start > <product-path> - Streaming Agent, right-click Configure Streaming agent, and select Run as administrator. On the General tab, enter the following:
On the Misc tab, enter the following:
On the Streaming tab, enter the following:
|
|
Launch the agent |
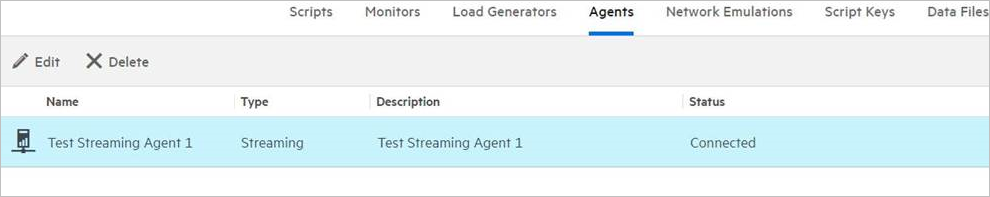
Go to Start > <product-path> - Streaming Agent > Start Streaming Agent. When the agent starts running, it is displayed in the Assets > Agents tab.
|
Install and configure a Docker container for a streaming agent
The following actions describe how to install and configure a Docker container for a streaming agent.
| Action | Task |
|---|---|
| Pull Docker image |
Pull the streaming agent Docker image from Docker Hub.
|
| Launch a container |
Run the following command to create the container in the background (detached) mode for InfluxDB version 2.x. Copy code
Run the following command to create the container in the background (detached) mode for InfluxDB version 1.8.x. Copy code
|
| Environment variables |
You can also pass environment variables using the --env-file command line parameter.
InfluxDB version 2.x:
InfluxDB version 1.8.x:
If the agent requires a proxy, provide the proxy details using the https_proxy or http_proxy environment variable. |
For details about managing the agents in OpenText Core Performance Engineering, see Agents.
Add the InfluxDB streaming agent
You can view streaming data metrics during the test run using the integration with the InfluxDB database. You can stream either raw or aggregated data.
Note: Streaming raw data is a technical preview and is limited to 5,000 Vusers, not including Vusers running on on-premises load generators.
For information on setting up the integration, see Install the streaming agent. After the integration is complete, you can configure the streaming agent.
To add an InfluxDB streaming agent:
-
In the Load tests page, click the Streaming agent button
 . It is available only after integration.
 -
Click + Add from Assets.
-
Select an agent and click Add.
-
In the Data Type column, choose Raw or Aggregated. If only one data type is enabled for your tenant, the relevant data type is displayed.
After you begin the test run, you can check the streaming data in the InfluxDB database using a monitoring tool such as Grafana.
InfluxDB database measurements
The following measurements are added to the InfluxDB database when the streaming agent is configured.
Aggregated data measurements
The following table lists aggregated data measurements.
| Measurement | Description | Tags | Fields |
|---|---|---|---|
| agg_running_vusers | Vusers running in the load test | emulationId, locationId, runId, scriptId | value |
| agg_failed_vusers | Vusers that failed in the load test | emulationId, locationId, runId, scriptId | value |
| agg_errors | Error messages | emulationId, locationId, runId, scriptId | value |
| agg_datapoints | Data, such as http_200 and http_302 | dataName, emulationId, locationId, runId, scriptId | count, value |
| agg_transactions | Transaction-related information | emulationId, locationId, runId, scriptId, txName, txStatus | count, max, min, sum, sumSqr, value |
| agg_disruptions | Disruption events | runId, name, type | value |
Note: If you configure LRC_CUST_APPLICATION, LRC_CUST_COMPONENT, and LRC_CUST_ENVIRONMENT as additional attributes in the script's runtime settings, they are exposed as extra tags (cust_app, cust_env, cust_component) for aggregated data measurements.
Raw data measurements
The following table lists raw data measurements.
| Measurement | Description | Tags | Fields |
|---|---|---|---|
| Transaction | Raw transactions | Name, ScriptName, GroupName, VuserID, Status, RunID, Product, Emulation, Region | StartTime, EndTime, ThinkTime, WastedTime |
| DataPoint | Raw datapoints | Name, ScriptName, GroupName, VuserID, RunID, Product, Emulation, Region | Value |
| Error | Raw error messages | Code, VuserID, GroupName, ScriptName, ActionName, Host, RunID, Product, Emulation, Region | Message, Iteration, FileLine |