Share this page


Trend Report
The Trend Report enables you to compare test runs for your script.
Note: Trend Report functionality is supported from version 25.3.
About the Trend Report
You can generate a Trend Report for a script, enabling you to compare the most recent test run with previous runs. The report show the trend for each transaction, using the transaction response time (TRT) defined by various metrics, such as the 90th percentile.
If you apply the trend report flag when executing your script, the measurements from the current run are saved to a dedicated folder in the script folder. These measurements are used to automatically generate the report, also saved in the script folder.
The report graphs can be generated in bar or line format, and you can compare each run to the previous one, or compare the most recent run to the oldest saved data. You can also opt for a dynamic format, enabling you to change the parameters directly within the report, so that the graphs are automatically updated. All definitions for the graph generation are in the common_config.yml file. For details, see Configure report settings.
The Trend Report is in HTML format, and can be opened in your preferred browser and shared with other stakeholders.

Generating the report
When you include the trend report flag on the command line for a test run, an additional data file is created for the script measurements. If the flag is not included in the command, the data file is not created, and the current test run will not be included in any future generated Trend Report.
To generate a Trend Report for a script:
-
When running the script, include the -summary=trend argument on the command line. For example:
DevWeb.exe -summary=trend <script folder>
-
After the script run, the following are automatically updated in the script folder:
-
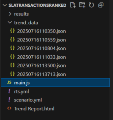
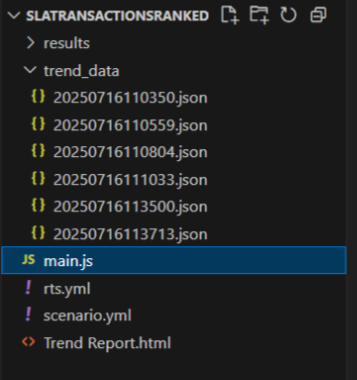
A new trend_data folder is created (if it does not exist already), and a .json file containing the data for the current run is added to the folder.
-
A Trend Report.html file is created (if it does not exist already).
Note: There is no limit to the number of .json files added to the trend_data folder. If you want to reduce the number of runs stored in the folder, or to exclude some from the report, delete them manually.
-
Viewing the report
To view the Trend Report for a script, access the script folder and open the Trend Report.html in a browser window.
The graphs have the following characteristics:
-
Each transaction in the script is displayed on a new line, in graph or bar format, depending on the selected format.
-
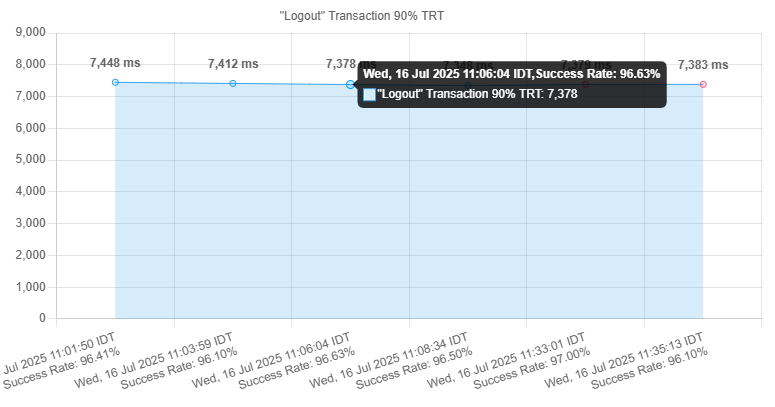
The most recent result is shown on the right side of the graph.
-
The higher TRT (according to the set comparison method) is shown in red.
-
Hover over a bar or data point to see information for that measurement.
By default, the report focuses on the last 6 test runs (or less, if there are less than 6 run results available). For static bar and line graphs, the comparison method, and metrics used for comparison, are according to the default definitions, and cannot be changed within the report.
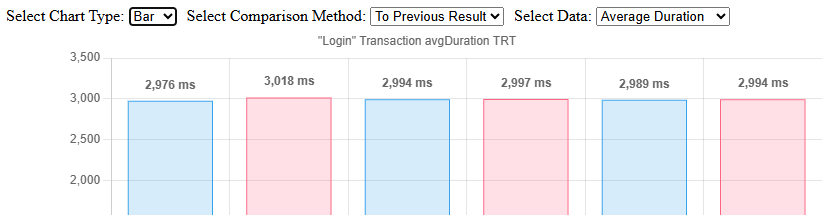
For dynamic reports, you can change the parameters directly within the report, and the graphs are updated automatically according to your selection.
To switch between static or dynamic reports, and change the default graph settings, see Configure report settings.
Dynamic graph example:
For more information on these parameters, see Configure report settings.
Configure report settings
The configuration for the Trend Report is in the trendReport area of the DevWeb root folder/common_config.yml file. You can edit the settings to change the default format for the generated report.
When the graphType is set to dynamic, the graph type, comparison method, and metric used can be changed within the report itself.
| Parameter | Description |
|---|---|
| graphType |
Define the type of report output:
|
| comparisonMethod |
Determines how the trend is calculated.
|
| measurementLimit |
Limit the number of run results to include in the graph. The value must be greater than 0. Default is 6. |
| metric |
The metric to use for the graph measurements:
|
After changing the configuration you can regenerate a report, so that it updates the report format using the results from the latest run. Use this command:
DevWebUtils.exe -mode=generateTrend <Script folder>
 See also: