
Share this page


Scripting with Visual Studio
This topic describes how to build and run DevWeb scripts using the Microsoft Visual Studio IDE.
In this topic:
Create external tools
When scripting with Visual Studio, you can create external tools that contain tasks to run DevWeb scripts. You need only do this once, and then you can use the tools for all your DevWeb scripts.
The following example describes how to create two external tools:
- DevWeb Single Run
- DevWeb Load
- DevWeb Debug
To create an external tool to run DevWeb scripts:
- In Visual Studio, select Tools > External Tools.
- In the displayed External Tools dialog box, click Add.
- Fill in the dialog box fields for each tool you create, as appropriate, using the tables below.
- Select the check box for Use Output window.
-
Click OK.
- After creating the external tool, it should be available to run from the Tools menu.
Field values to create the tools:
| Field name | Value |
|---|---|
| Title | DevWeb Single Run |
| Command |
%DEVWEB_PATH%/DevWeb.exe (if you do not have the DEVWEB_PATH environment variable defined, use the full path) |
| Arguments | -ide=vs $(ProjectDir) |
| Initial directory | $(ProjectDir) |
| Field name | Value |
|---|---|
| Title | DevWeb Load |
| Command |
%DEVWEB_PATH%/DevWeb.exe (if you do not have the DEVWEB_PATH environment variable defined, use the full path) |
| Arguments | -mode=load -ide=vs $(ProjectDir) |
| Initial directory | $(ProjectDir) |
| Field name | Value |
|---|---|
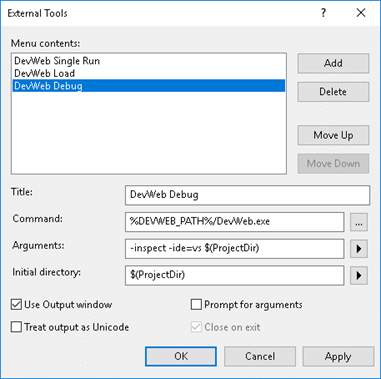
| Title | DevWeb Debug |
| Command |
%DEVWEB_PATH%/DevWeb.exe (if you do not have the DEVWEB_PATH environment variable defined, use the full path) |
| Arguments | -inspect -ide=vs $(ProjectDir) |
| Initial directory | $(ProjectDir) |

Debug DevWeb projects
You can use the following process to debug your project in the Visual Studio IDE.
Tip: You need to repeat the process every time you want to debug, which can be inconvenient. We recommend using Visual Studio Code to debug instead - see Create DevWeb scripts in VS Code.
To debug a DevWeb project:
- Create a DevWeb Debug external tool, as described above.
- With the project selected, run Tools > DevWeb Debug. DevWeb starts, but the test will not run.
- In the main menu, click Debug > Attach to Process. The Attach to Process dialog box is displayed.
- In the Connection type field, select WebKit websocket (no authentication).
- In the Connection target field, type http://localhost:9230 (note that the host and port are configurable from the config.yml file, jsInspector section).
- Press ENTER on the keyboard. The correct process should be displayed in the Process area.
- In the Attach to field, enter WebKit code.
-
Select the correct process and click Attach.


 See also:

