Share this page


Run Dashboard
The Run Dashboard displays details of the running performance tests, and enables you to perform all runtime test run actions.
Tip: You can also view performance measurements for tests that have finished running in offline graphs. For details, see View test run results offline.
Interactive Run Dashboard
The Run Dashboard opens automatically when a performance test starts, or when you open a running test. The dashboard displays a synopsis of the running performance test, and provides all the available options for managing the test run.
The banner contains summary information such as the Run ID, test name, current state, Vuser errors, transaction status, and Vuser run status. By default, the dashboard shows some common graphs, such as the number of Running Vusers, Error statistics, and Throughput.
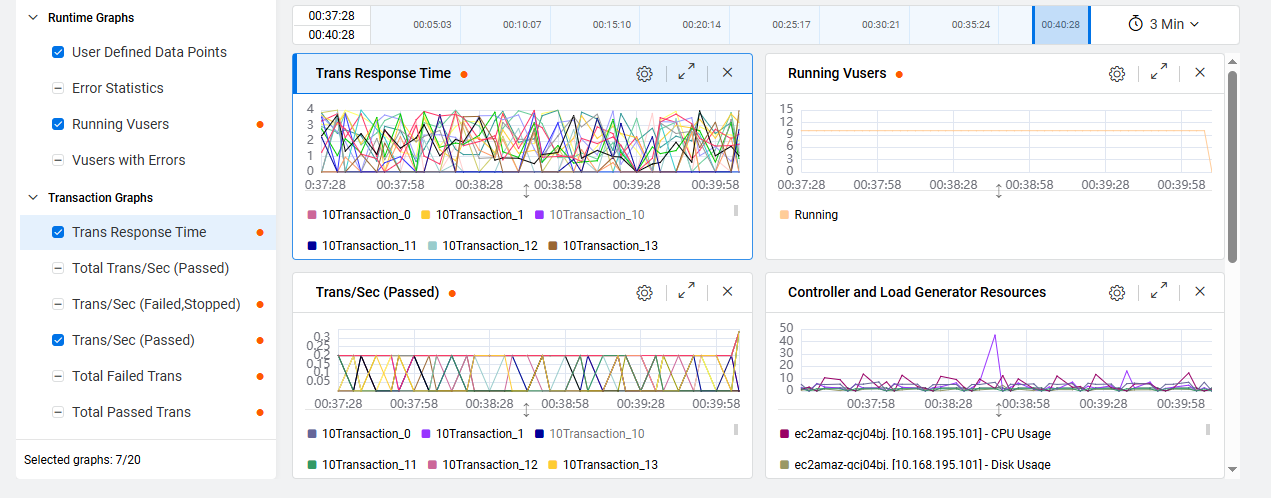
The Graphs tree contains a list of the available graphs that you can add to the display. The graphs are listed by category, such as Runtime Graphs, System Resource Graphs, and Transaction Graphs.
Tip: Hover over a point in the graph to open a popup window showing the current values of the measurements.
For details on other resources that are available in the results page such as result files, event logs, and audit files, see View results offline.

Run Dashboard views and toolbar
The following views are available in the Run Dashboard.
| View | Description |
|---|---|
| Graphs | The Graphs view displays performance measurements for those resources being monitored in a performance test. This view is displayed by default in the Run Dashboard. For details, see Graphs view. |
| Groups | The Groups view displays the statuses of the Vusers in the performance test. For details, see Groups view. |
| Transactions | The Transactions view displays how many transactions have been run successfully or unsuccessfully. For details, see Transactions view. |
| Messages | The Messages view displays error, warning, debug, and output messages that are sent to the Controller by the Vusers and load generators during a test run. For details, see Messages view. |
| Monitors | The Monitors view displays monitors from all the monitor profiles and over firewall agents that are associated with the selected test. You can add new monitors to the test from this view. For details, see Monitors view. |
The following toolbar buttons are available in the Graphs, Groups, and Transactions views of the Run Dashboard.
|
UI Elements |
Description |
|---|---|
|
Displays specific details for each Vuser in the performance test, and enables you to run or stop Vusers irrespective of their defined schedules. For user interface details, see View Vuser details. |
|
|
Enables you to run additional Vusers during the course of a performance test. That is, you can run Vusers that are not included in the test's original defined schedule. For details, see Run Vusers. |
|
|
Enables you to manage the load generator in the performance test. For details, see Manage load generators. |
|
|
Enables you to extend or shorten the duration of the performance test. For user interface details, see Change timeslot duration. |
|
More

|
Click to display the following options:
|
|
Enables filtering the information being displayed in each of the views by the search string. |


Graphs view
Note: The user interface was modernization in 25.3 and these updates are reflected in the help. While some steps may differ slightly in 25.1, the core functionality remains the same.
To access: In the Run Dashboard select the Graphs view.
You can manage the graphs in the following ways.
|
Action |
Description |
|---|---|
| Add a graph to the dashboard |
In the Graphs tree, click the Display graph button
A maximum of 12 graphs can be displayed simultaneously. |
| Merge into an existing graph |
You can merge graphs using the following methods:
The merged graph is displayed in the graph editor. Graphs that are merged are displayed in the Merged list in the graphs tree. Note:
|
| Rename a graph |
In the Graphs tree, click the More action button |
| Duplicate a graph |
In the Graphs tree, click the More action button |
| Rearrange the graphs | Select a graph and drag the graph by its anchor  to the desired location. to the desired location. |
|
Adjust the time range displayed in graphs |
In the timeline area, expand the Granularity list
When set to Manual focus, drag the slider in the timeline to choose a start time and end time. You can also specify the time manually in the time string. The slider automatically reflects the values that you entered. You can also move the selection (maintaining the same granularity), and select a new range. Note: To ensure the correct real time for running the performance test is displayed in the online graph, the time zone on the OpenText Enterprise Performance Engineering Server and any external analysis database servers must all be synchronized. |
| Configure global settings |
Click the Settings button
|
| Change the line colors | In the legend, click the color assigned to a measurement to open the color selector, and choose a different color. |
 adjacent to the graph name to display a graph in the dashboard. The tree displays the configured graphs and merged graphs that are available.
  Indicates the graph is currently being displayed in the graph editor.
 Indicates an anomaly has occurred in the graph.
 Indicates a merged graph.
 and set it to display the Last 3 minutes, Last 10 minutes, Last 1 hour, Whole Run, or Manual focus. The selected time range is displayed in the input panels located to the left of the range.
 located above the timeline area, and set the following options:
Individual graph controls
You can manage individual graphs in the following ways.
|
Action |
Description |
|---|---|
| Configure individual graph settings |
Click the Settings button
|
| Rename a graph |
Hover over the graph name and click the Edit button |
| Maximize a graph and control the measurements pane |
Click the Expand button
|
|
Minimize a graph |
Click the Contract button |
 in the graph's toolbar to maximize the selected graph. When you maximize the graph, you have access to the following controls in the Measurements pane:
 . Drag up or down to resize the graph area and the measurements grid.
 . Select and rearrange measurement details in the grid columns. For details, see
  . Search for measurements by name in the legend.
 . Displays the measurement in the graph.
 . Hides the measurement from the graph.
 . Displays the measurement in bold in the graph.
  . Select to save the measurement as a favorite.
 to minimize the graph and return to the graphs pane which displays all the selected graphs.
 Measurement details are described in the table below.
|
Option |
Description |
|---|---|
| Name |
The measurement name. A warning icon Note: IP addresses for over firewall monitors (MOFW) and load generator hosts (OFW) display the IP address for the MI Listener and not the actual host IP address. |
| Scale | The graph scale. |
| Max Value | The measurement's maximum value. At every time stamp, the maximum values among all Vuser data points are selected. Then, the maximum of all these values is displayed. |
| Min Value | The measurement's minimum value. At every time stamp, the minimum values among all Vuser data points are selected. Then, the minimum of all these values is displayed. |
| Average | The measurement's average value. |
| Std Dev | The measurement's standard deviation. |
| Last value | The measurement's last value. |
| Machine | The name of the load generator machine. |
| Anomalies | Turn the switch on or off to show or hide anomalies associated with the measurement. |

|
Indicates if the measurement is set as a favorite. |
| <page list> |
Enables you to move to the first, last, or a specific graph measurements page. Note: Displayed only for graphs that have at least 20 measurements. |
Groups view
The Groups view displays the statuses of the Vusers in the performance test.
To access: In the Run Dashboard select the Groups view.
User interface elements are described below.
Transactions view
The Transactions view displays the number of completed, successful and unsuccessful transactions performed during the test run.
To access:
-
In the Run Dashboard, select the Transactions view.
-
In the Run Dashboard banner, click the Transactions the Details link. To display transactions sorted by status, click the passed or failed transaction button
 .
.
User interface elements are described below.
|
UI Elements |
Description |
|---|---|
| Name |
The transaction name. For details on transaction names, see Transaction naming conventions. |
| Passed |
The number of times the transaction passed. |
| Failed |
The number of times the transaction failed. |
| Stopped |
The number of times the transaction stopped. |
| Success Rate % |
The transactions success rate percentage. |
| TPS |
The number of times per second the transaction has run. |
Tip: You can also view details of failed transactions in the test run using Quick Trending, and perform trending analysis by drilling down and investigating specific transactions related to the run. For details, see Perform quick trending analysis.
Messages view
The Messages view displays error, warning, debug, and output messages that are sent to the Controller by the Vusers and load generators during a test run.
To access: In the Run Dashboard select the Messages view, or click the error link in the banner.
User interface elements are described below.
|
UI Elements |
Description |
|---|---|
|
Group by |
Enables grouping messages by Code, Message, Host, Script, or Vuser. After you have selected a grouping, the grid displays a drilled down view. You can click a link to filter grid data by the selected value. For example, if data is grouped by Code and you drill down on a specific code, the grid displays all messages for the selected code. Note:
|
| Type |
Enables filtering the messages by a specific message type:
Default: All Types |
| Sort by |
Enables sorting column values by Time, Type, Code, Message, Host, Script, or Vuser. After selecting a sort value, the latest 50 messages are displayed on the page. You can scroll to see additional pages (each page displays the next 50 messages). Click the Change sort order button Note: When you change the sort order in the online screen, scrolling is limited to displaying the first 500 rows only, according to the selected sort order. Offline view retains full sorting functionality, enabling you to scroll all messages (in rows of 50). |
| Vuser Log |
Select a row in the grid and click Vuser Log. The Vuser activity log opens, enabling you to view a list of messages for each Vuser. The log contains the following information:
Note:
|
| Clear All Messages |
Clears all messages. Note: This option is not available in the offline results view. |
| Refresh All |
Select the refresh option:
Note: This option is not available in the offline results view. |
| Time |
The time the message was generated. Note: Displays the time according to the UTC time zone if Time Display > Custom time zone was selected in the Graphs view. For details, see Time Display. |
| Type |
The type of message. For details, see Type above. |
| Code | The message code. |
| Message |
The received message. To copy a message to the clipboard, right-click the message and select Copy to clipboard. |
| Host |
The host that generated the message. You can click a host link to group messages by the selected host value. |
| Script | The script that generated the message. You can click a script link to group messages by the selected script value. |
| Action | The action in the script where the message was generated. |
| Line | The line in the script where the message was generated. |
| Iteration | The iteration during which the message was generated. |
| Vuser | The Vuser which generated the message. You can click a Vuser link to group messages by the selected Vuser value. |
| Total Messages |
The total number of messages received for the selected grouping. Note: Displayed only when messages are grouped. |
| Total Vusers |
Displays the total number of Vusers for the selected grouping. Note: Displayed only when messages are grouped. |
 are enabled; otherwise Sort by and Change sort order
 Monitors view
The Monitors view displays monitors from all the monitor profiles and over firewall agents that are associated with the selected test. You can add new monitors to a running test from this view.
Note:
-
This view is only available if monitors are associated with the running test.
-
Any monitors that you add during the test, or updates you make to existing monitors from this tab, do not affect the monitor profile and are discarded after the test run.
To access: In the Run Dashboard select the Monitors view.
-
To view monitor profiles associated to the test or to add a new monitor, select the Runtime Monitors tab. For details on adding and managing monitors while a test is running, see Manage runtime monitors.
-
To view all monitor over firewall agents associated to the test or to add a new monitor over firewall agent, select the Monitors Over Firewall tab. For details on adding a new monitor over firewall agent, see Create a monitor over firewall agent profile.
 See also: