Share this page


Running performance tests
Now that you have designed the performance test, added an instance of the test to a test set, and reserved a timeslot for the test, you are ready to run the test and observe how your application performs under load.
How do I run the performance test?
You run the performance test as follows:
-
In the banner, click the module name or arrow and select Test Management > Tests & Scripts.
-
Select your test in the test management tree.
-
Click the Run Test button. The Run Performance Test dialog box opens.
-
Click the Reserved Timeslot tab.
-
Select the timeslot you reserved, and click Run.
The Initializing Run page displays the performance test initialization steps, and the status for each step. If each step is completed successfully, the performance test starts running and the Run Dashboard opens. The Test Run page enables you to manage and monitor the test as it runs.

What does the Run Dashboard display?
The Run Dashboard is the control center from which the test run is managed and monitored.
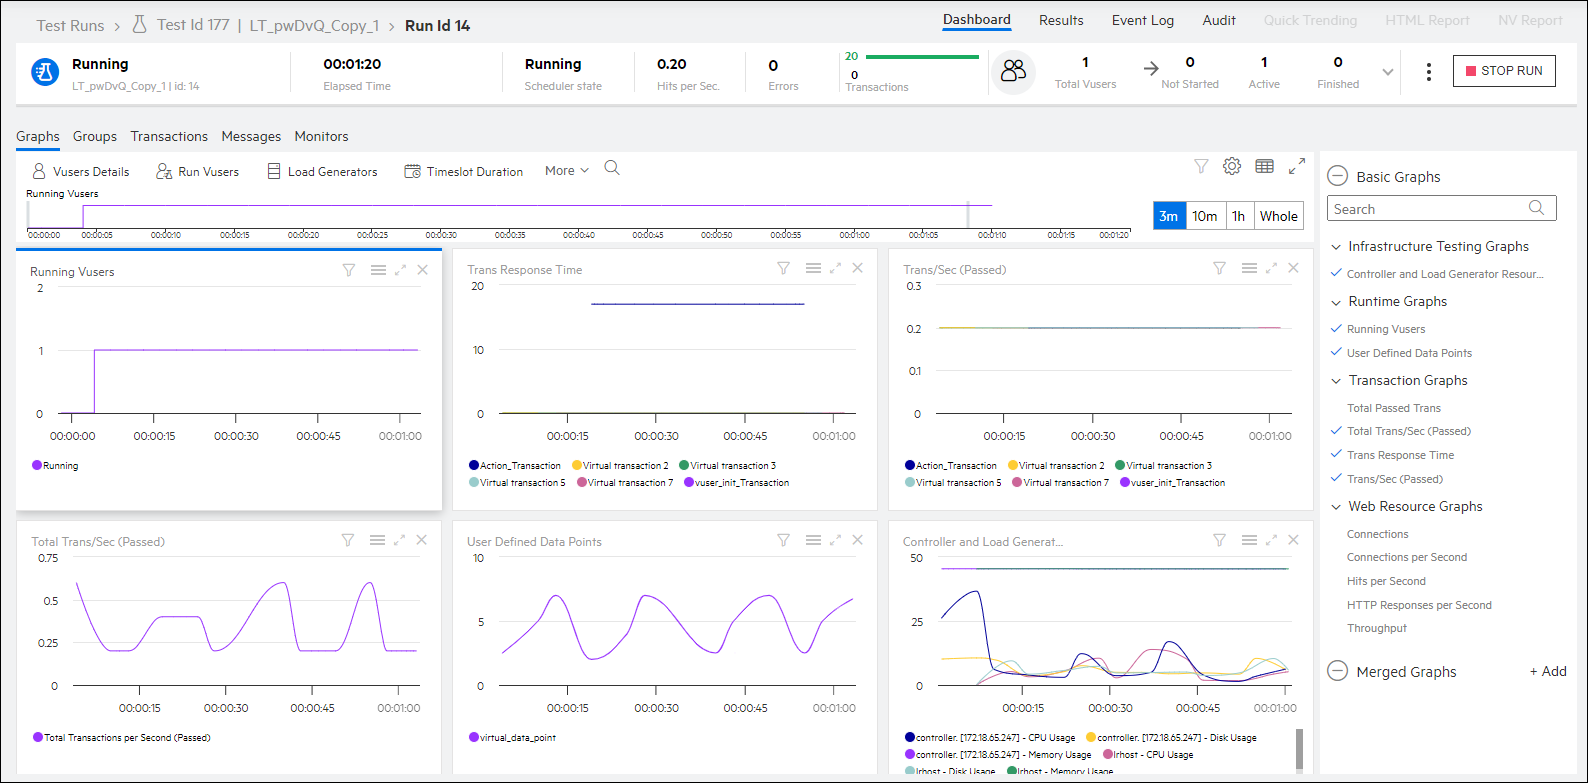
The Run Dashboard displays the following.
|
Pane/Tab |
Description |
|---|---|
|
Summary |
The Summary pane displays a synopsis of the running performance test. |
|
Test run views |
The Test Run Details area provides four views:
|
|
Tabs |
In the Graphs pane, click the More button and select Graphs. A list of the configured online graphs is displayed. You can select which graphs to display in the Graphs view. |
 Next steps: