Share this page


View test-run statistics
While a test is running, or after a test has been run, you can view various statistics relating to the test-run. NV Test Manager derives the statistics by analyzing the flows that are defined in the test, while the test runs. The statistics are displayed in charts – you can select which charts to display, and how to display the charts.
Tip: Not sure if your application's traffic is passing through Network Virtualization? While the test is running, open the Statistics tab and verify that data is displayed in the throughput charts.
For details on the various test-run statistics charts, see Test-run statistics charts.
View test-run statistics
- In NV Test Manager, click Tests.
- From the lists of Running tests and Completed tests, locate and open the test for which you want to view run statistics.
-
Click the Statistics tab to display the default set of statistics charts.
For details on the various test-run statistics charts, see Test-run statistics charts.

Customize the chart display
Perform any of the following optional steps:
- Click Charts
 to change the list of charts that are displayed. You can show up to six charts concurrently. The charts appear in the order in which you select them.
 - Click Flows
 to specify the flows to include in the charts.
 - Click the maximize button
 to enlarge the associated chart; click the minimize button
  to display a chart in its regular size.
Set the chart display duration and display period
Note: This functionality is available only for tests that are no longer running.
Scroll to the bottom of the screen to display the Chart Duration Display control.
-
Click any of the "chart display duration" buttons [1 min, 15 mins, 1 hour, 1 day] to set the duration to display in the charts.
-
Click inside the duration indicator and drag it to display a specific period in the charts.
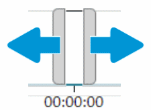
-
Drag either side of the duration-indicator to modify the duration and time period displayed in the charts.