Share this page


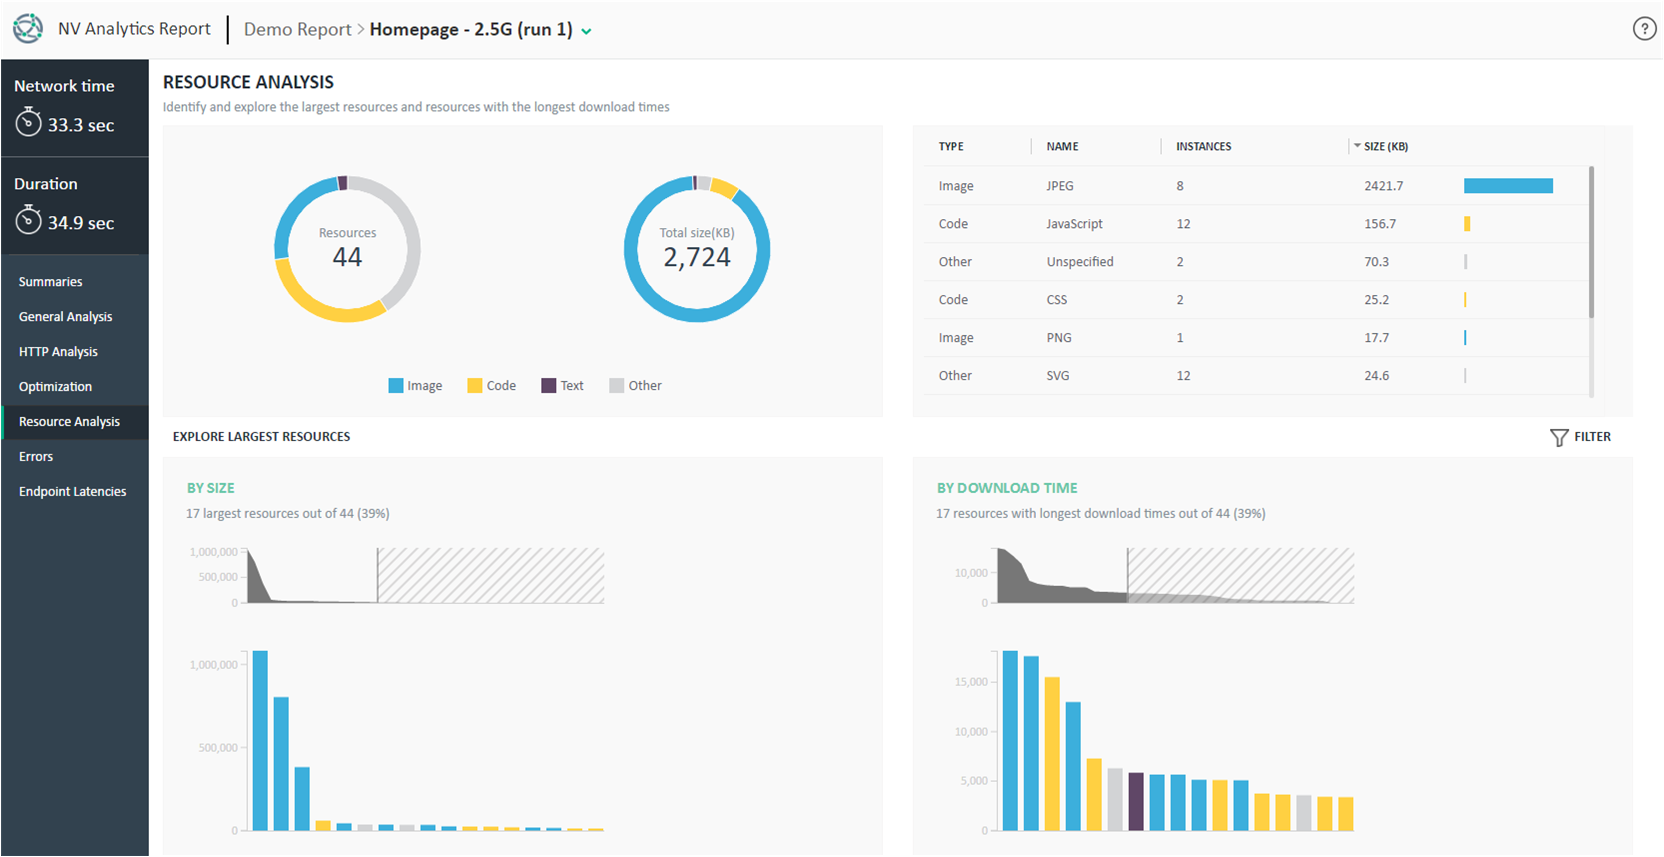
Resource analysis
The Resource Analysis page displays information about the resources that were downloaded during the transaction. You can use this page to identify potentially problematic issues in your transactions.
View resources by type and subtype
These charts, at the top of the page, provide a summary of the downloaded resources.
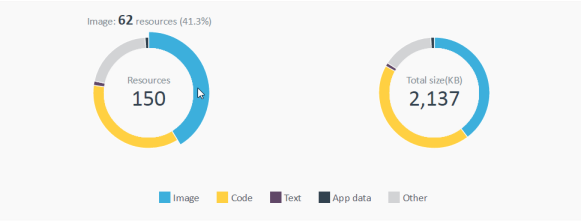
In the chart on the left, hover over a section of a donut chart to view details. For each resource type, the quantity, relative quantity, total size, and relative total size are displayed.
The percentage represents the relative size of the selected section out of the total number of resources that were downloaded.
Consider the following when looking at this graph:
- Do the resource types match your expectations?
- Are the relative sizes of each type as expected?
Suppose that a resource type is defined as code. A subtype of that resource might be HTML or CSS.
The subtype chart on the right lists each resource subtype (in the Name column), as well as the resource type, the total number of downloaded instances of the subtype, and the total size of downloaded instances.
The right-most column displays a graphical representation of the relative size of the resource subtype as compared to all resource subtypes in the transaction.
In the following example, the JavaScript code is a much larger part of the transaction than CSS code.
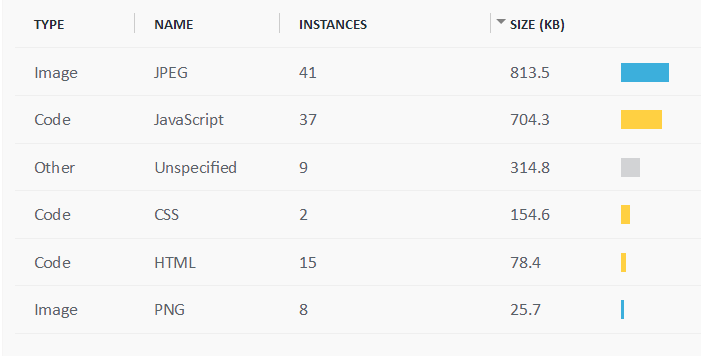
You can sort the table by any column.

View resources by size and download time
These graphs let you explore the largest resources.
When looking at your graphs, check whether the resources with the longest download times are also the largest resources. Closely examine resources that are inconsistent. A relatively small resource with a long download time might indicate an issue that needs to be addressed. For example, it could indicate that it is taking a long time to process the request on the server before it is sent back to the client.
Look at the By Size graph. Are there large resources that you did not expect? You might want to review optimization recommendations that can help to reduce the size of those resources.
In the By Download Time graph, look at the resources with the longest download time . You might want to review optimization recommendations that can help to shorten the download time of those resources.
In the following example, you can see that the resource with the slowest download time is actually a relatively small resource—the 60th largest out of 68 resources.
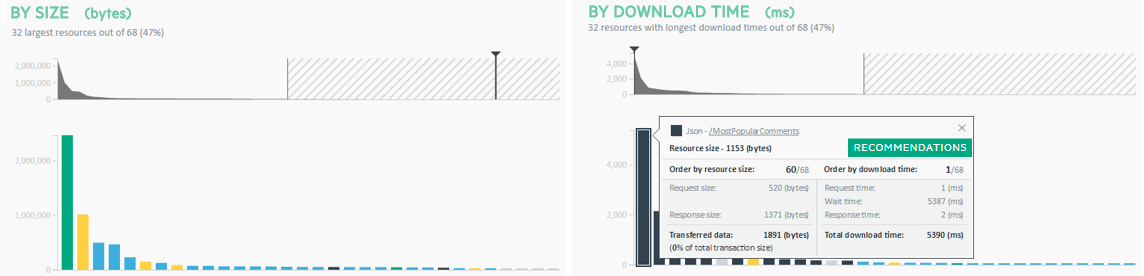
The black line on the By Size graph, which marks the resource location, is located in the right part of the graph, while the black line in the By Download Time graph is located on the left part of the graph. This indicates that it took a long time from the moment we sent the request until we finished downloading the response.
Note: Depending on your screen resolution, these graphs display either the 32 or 17 resources with the largest sizes and longest download times.
Hover over a bar in the graph and notice the following:
-
A vertical line (the yellow line in the example below) in the upper graph represents the relative location of the bar you have selected in the lower graph.
-
The resource bar you select in the By Size graph is also highlighted in the By Download Time graph (and vice versa).
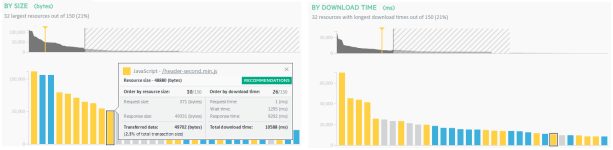

Click a bar in the graph in either graph to display more details in a popup.
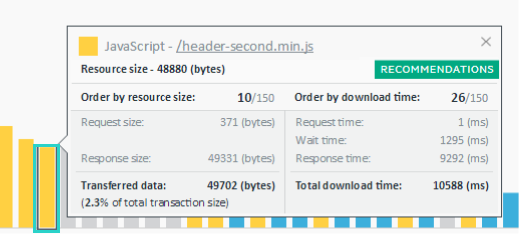
| Item | Description |
|---|---|
| Title | Resource type and name, and a link to open the resource's URL. |
| Resource size |
Size of the actual resource, such as an image, or JavaScript code. |
| Order by resource size |
The position of the selected resource among all resources in the transaction, ordered from largest to smallest. For example, 10/150 indicates the 10th largest resource out of the 150 resources in the transaction. Request size/Response size. The total request size includes both the header and the body. |
| Transferred data | Total size of transferred data. This includes both the request and the response. |
| Order by download time |
The position of the selected resource among all resources in the transaction, ordered from longest to shortest download times. For example, 4/150 indicates the resource with the 4th longest download time out of the 150 resources in the transaction. Request time. The time spent sending the network request. Wait time. The time spent waiting for the initial response. This is also know as the Time to First Byte. This value includes the time spent on the round trip to the server, and the time spent waiting for the server to deliver the response. Server time. Time estimate for the web server to process the request and prepare the response. Response time. The time spent receiving the response data. |
| Total download time | Total time for downloading the resource, including request, wait, and response times. |
| Recommendations |
Opens the HTTP Waterfall page and displays optimization recommendations for improving the application. |
Filter the displayed data.
Click the Filter button  and expand a category to select the resource types you want to display. The filter impacts only the By Size and By Download Time graphs.
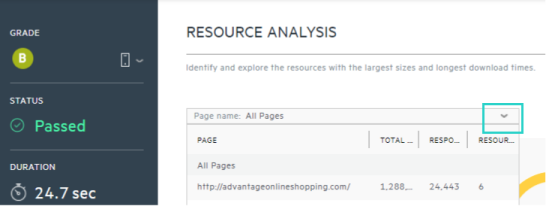
LoadRunner Cloud: View resources by page
From the top-left corner of the page, under the Resource Analysis header, you can select a page from the drop-down list to view data for a specific web page that was accessed during the transaction.
Note: Relevant for TruClient scripts only.