Share this page


Dashboard
The main page of the NV Insights report provides a dashboard showing summary information for the workload and each of its group's scripts. The impact of different networks on transaction duration is clearly illustrated, as are optimization grades that include links to optimization recommendations for your applications.
The dashboard is available for tests run from the LoadRunner Professional and LoadRunner Enterprise Controller.

Start time
The start date and time of the run.

Analysis coverage
Selected scripts. The total number of unique scripts included in the report.
Virtual locations. The total number of unique virtual locations included in the report. A virtual location can represent a geographical location, such as London, or a mobile network type, such as 4G.
Selected groups. The total number of groups that were selected for NV Insights analysis. Network Virtualization analyzes every group for which the NV Insights check box was selected when defining the groups to include in the run. The NV Insights check box is located in:
- LoadRunner Professional: Scenario Scripts pane
- LoadRunner Enterprise: Groups area of the Groups & Workloads view
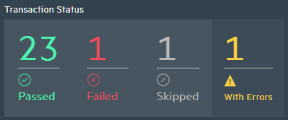
Transaction status
Transaction status shows the total number of transactions that
A skipped transaction is a transaction that ran successfully (regardless of the pass/fail status) on at least one network, but did not run on at least one other network. For example, a transaction may have run successfully both without network emulation and over 4G, but did not run over 3G, for some reason.
Transactions with errors displays the number of transactions that had errors, regardless of their pass/fail status.
Data regarding the pass/fail status, and the number of transactions that ran with errors, is received directly from the testing tool, such as VuGen.
Visibility:
-
The black area at the top of the page shows the transaction status for all transactions in entire test.
-
Under Transaction distribution by script and virtual location, you can see the transaction status for the transactions in each script.
Click to open the Transaction Overview page for more details and to drill down.
Network impact
Network impact illustrates the effect of networks on transaction duration.
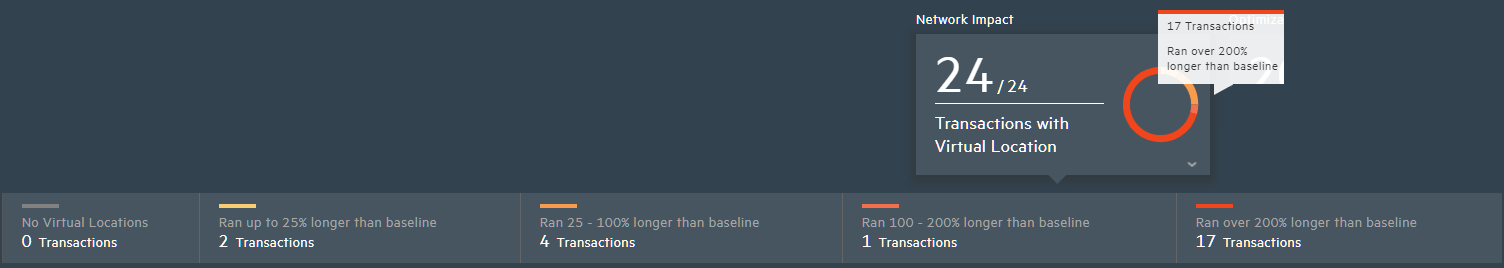
Click anywhere in this box to show/hide a bar displaying the number of transactions in each range in the test, as well as how much longer it took to run the transactions with virtual locations than it took to run them without. The time is displayed as a percentage range. For example:
Example: If a transaction ran:
-
10 seconds without a virtual location
-
12 seconds with a virtual location
The network impact percentage would be "Up to 25% longer than baseline" because it took 20% longer to run the transaction with a virtual location.
If a transaction ran:
-
10 seconds without a virtual location
-
25 seconds with a virtual location
The network impact percentage would be "Over 200% longer than baseline" because it took more than twice as long to run the transaction with a virtual location.
Determining network impact
During a LoadRunner Professional or LoadRunner Enterprise run session, Network Virtualization runs two additional iterations with one Vuser on every group for which the NV Insights check box is selected.
The first iteration on each group runs without virtual locations at the beginning of the test. This creates a baseline indicating how long transactions in a script take without network emulation. If the same script was included in more than one group, the baseline represents the minimum time it took to run the script's transactions on all groups running that script.
Later in the test, Network Virtualization runs an additional iteration on every group using the specified virtual locations. This is know as the analysis run. Analysis runs emulate real-world networks and can differ greatly from baseline runs.
The resulting response time gap between the baseline and analysis runs is the network impact. This indicates how network properties impact your application. The smaller the time gap, the better your application is optimized.
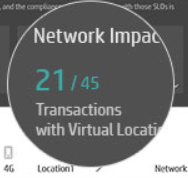
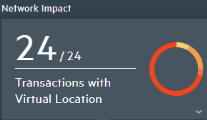
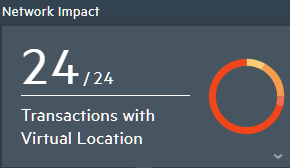
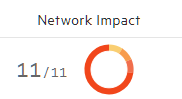
Transactions with virtual locations
The highlighted numbers represent the number of transactions that ran with virtual locations (emulating networks) out of (/) the total number of transactions. For example, 10/22 indicates that out of a total of 22 transactions, 10 ran with emulated networks.

Summary of all transactions selected for NV Insights analysis. Each colored piece represents the total number of transactions that ran within a specific network impact range. Ranges for successful transactions that ran with network emulation are shown as percentages (%) above or below the baseline transaction duration.
Hover over the pieces in the chart to view the highlighted network impact ranges.
Visibility:
-
The black area at the top of the page shows the network impact for all transactions in entire test.
-
Under Transaction distribution by script and virtual location, you can see the network impact for the transactions in each script.

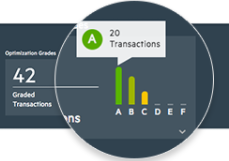
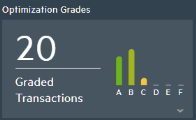
Optimization grades
Optimization grades indicate how well your application's transactions perform. Grades range from A-F. The higher the grade, the better your transaction is optimized.
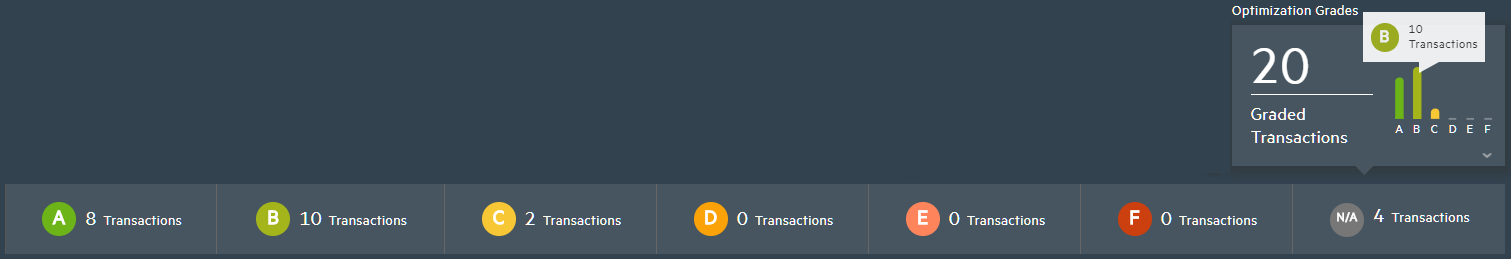
Click anywhere in the box to see how many transactions there are for each grade.
Importance of optimization
Optimized applications perform better and run faster and more efficiently. For example, two web pages that look exactly the same can load at very different speeds if one of the pages is optimized and the other is not.
As part of the analysis process, NV Insights provides recommendations for optimizing your application so that network emulation is as efficient as possible. Each action is measured against accepted industry standards as well as OpenText's enhanced best practices to detect performance issues.
Grading transactions
Each transaction is given a score comparing the transaction to programming best practices, as well as priority, based on the potential performance improvement to be obtained if the recommendation is implemented. The scores are totaled and converted to grades, based on the level of compliance, where 'A' is the most compliant.
Bar chart
Each bar is a different color, representing a grade. Hover over a bar to see how many transactions received a particular grade.
Visibility:
-
The black area at the top of the page shows the optimization grades for all transactions in entire test.
-
Under Transaction distribution by script and virtual location, you can see the optimization grades for the transactions in each script.


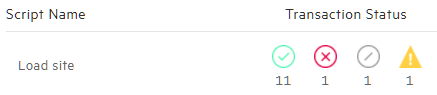
Transaction distribution by script and virtual location
This area lists all of the scripts that were included in the run.
Click a script to drill down and view transaction details.
For each script, the following is displayed:
- Transaction status. The status of each transaction in the script.
- Virtual location. The number of transactions for each virtual location. Click the mobile/desktop icon to toggle between mobile and desktop results. Notice how this affects other data.
-
Network impact. The number of transactions that ran with virtual locations (emulating networks) out of (/) the total number of transactions.
The pieces in the donut chart indicate the total number of transactions that ran within a specific network impact range.
Click anywhere in this area to show/hide a bar displaying the number of transactions in each range in the script, as well as how much longer it took to run the transactions with virtual locations than it took to run them without.
-
Optimization grades. Notice how the grades change when you click the mobile/desktop toggle. Click anywhere in this area to show/hide a bar displaying the number of transactions that received each optimization grade.
Help button
Click to learn more about the terms used in this report and to access this Help. The embedded pages are included with the report. This ensures that anyone that accesses a report can learn more about it, even when offline.
 Next steps: