Share this page


Summaries
The Summary report displays the Client Network Server Breakdown of the action and various metrics.
Protocols
The following is an example of a summary report.
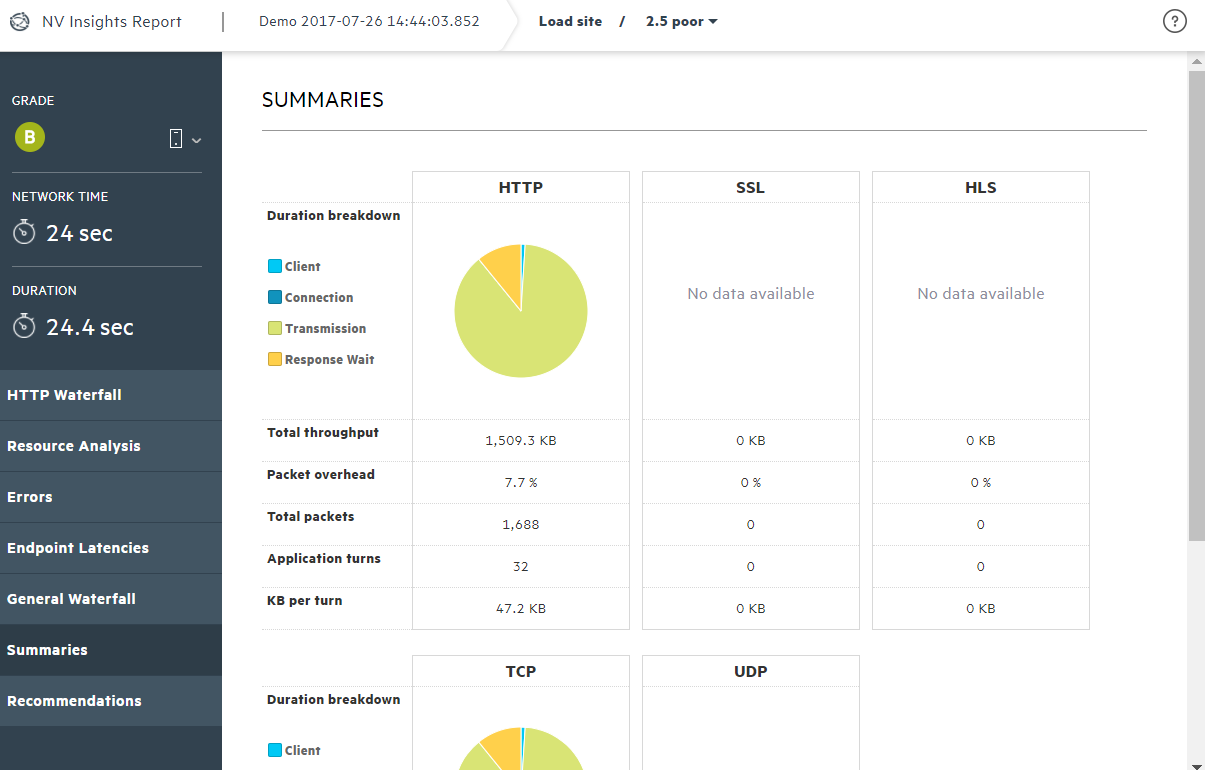
The following protocols are included in the summary:
-
HTTP
-
SSL (secure communication)
-
HLS (HTTP Live Streaming)
-
TCP
-
UDP
Note: The side bar may be different depending on the testing tool from which NV Insights was generated.

Duration Breakdown
The values for the fields shown in each pie are:
-
Client: Portion of time that the client process ran (does not include time waiting for a server response)
- Connect: Portion of time in which the client connects to the server, such as the request in TCP or SSL handshake (the establishment of a secure channel)
-
Transmission: Portion of time data was downloaded or uploaded
- Response wait: Portion of time spent waiting for the server’s response
Metrics
The following metrics are included in the summary:
- Total throughput: The total amount of transmitted data (KB)
- Packet overhead: The percentage of the total bytes per protocol used by non-data elements
- Total packets: Total number of packets associated with the protocol
- Application turns: The number of times a communication flow change occurs from the request to the response, per protocol
- KB per turn: The average of the throughput per application turn, per protocol