Share this page


Analyze builds
The Builds tab shows details about the builds that ran as part of a pipeline run. The following section describes how to use build failure classification to pinpoint the source of build failures.
Build details
When you select a pipeline step in the left pane, the Builds tab shows build details of the selected step, and of its child pipeline steps. For each build you can see the build's status, number, and duration, the build run history  , the percentage of failed tests in this build that are being handled
  , and so on.
If configured, a custom report link to a build report stored externally is also available. For details on configuring custom build report links, see Label and configure pipeline steps.
Set the Who's on it? field to assign someone to investigate a failed build, as described in the section Assign someone to investigate failures. This is useful in case the build failed for reasons that are not related to a specific test. For example, the environment may need attention, or the build may have failed during compilation. For details, see Build failure classification below.
You can navigate between runs to help troubleshoot problems, using the Run selector in the upper right corner. Note that the Overview tab will always show the latest run.
Tip: Some builds might not be included.
You can configure hiding builds failures resulting from specific pipeline steps. For details, see Configure steps: Ignore or hide results of specific steps.
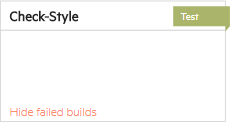
To check whether a step's builds are hidden, look at the step in the pipeline's Topology tab:

Build failure classification
A build failure classification label on a failed build indicates the type of issue that caused the failure. For example, Test code issue, Code issue, and Environment issues.

Use the build failure classification to determine who needs to handle the pipeline run failures and what issues need to be addressed.
You can classify builds manually to document the result of an investigation. For Jenkins builds, you can also create rules that enable ALM Octane to automatically classify your builds based on the build logs. For details, see Analyze logs.
The build failure classification is also presented at the pipeline run level. You can see the number of failed builds in this pipeline run, broken down by type of failure.
To view only build failures with a specific build failure classification, add a cross-filter using the CI build. Build fail classification field:

To understand what are the most common reasons for your build failures over time, add the Pipeline build failure classifications over time widget to your pipeline's dashboard. Hover over a specific run to see its classification details. Use this widget to determine whether your network or database is causing a lot of problems, tests are changing too often, code errors are being introduced and so on.
Tip: By default, this widget is set to show builds from the past week and to hide Unclassified builds if there are any classified builds.
Classify build failures manually
After you investigate a build failure and know what caused it, use the Build Failure Classification  button to label the failed build. This helps you share the results of your investigation and keep track of them for future analysis.
To add, replace, or clear the classification label:
-
In a pipeline run, open the Builds tab.
-
Select one or more failed builds.
-
Click the Build Failure Classification
toolbar button.Add new classification labels to the list.
-
Select a classification label from the drop-down list.
If the build was previously classified automatically, your manual classification overrides the automatic one.
Tip: To clear the classification label, click Clear
 See also: