Share this page


Analyze automated test run results
After automated tests run, analyze the results at the test level or pipeline level or the test run level.
In this topic:
- What are you analyzing?
- Examine failures from test runs
- Examine test failures from a pipeline
- Examine test results in an external tool
- Examine overall automation test results
What are you analyzing?
When you examine a test result (success or failure), there are many places to examine:
-
Details about the root cause of the failure.
-
Details about the pipeline run/build in which a specific run failed.
-
Previous run history. This also includes seeing when, how frequently, and why the test is failing, and to check whether it is always due to the same problem or different causes.
- Error messages and types

Examine failures from test runs
-
In the Backlog, Team Backlog, or Quality module, select the Tests tab.
Tip: Select the Latest pipeline run tag to exclude automated tests skipped or removed from the pipeline's latest run. The display includes manual tests, executable automated tests, and automated tests that ran as part of a pipeline's latest run.
If a new pipeline run is in progress, some tests that ran on the previous pipeline run are still included.
-
Click the ID of a specific automated test.
-
Select the Runs tab. This tab includes one test run entity for each set of environment settings on which the test ran. Each entity contains detailed information about the last time the test ran with these environment settings and basic information about the previous runs.
Tip: In the test run grid, add the Problem column to see whether the test has a history of unsuccessful runs. For details, see Identify problematic tests.
-
Click the ID of a specific failed test run.
-
In the Details tab:
-
Hover over the Build status icon
 to view build failures and details about the build in which this specific run failed, including when the build failure occurred, and the number of tests that passed, failed, or need attention. If at least one test fails, ALM Octane considers the entire build as failed.
 -
Check Who's on it? to find out who is investigating this failed test.
If you assign someone to investigate the test, this assignment remains on subsequent failed runs of the test. The assignment is cleared when the test passes successfully.
Tip: To have an email notification sent to the person you assign, assign Who's on it? in the Tests tab of a pipeline run. For details, see Expand your test failure analysis.
-
Click the Testing tool report button
 to navigate to the report created by the testing tool that ran the test, when applicable.
 -
Click Open build report or Open test run report to open a report stored on your CI server or elsewhere.
This link is provided if a template was configured for such links on the pipeline step. For details, see Label and configure pipeline steps.
-
Click the Pipeline links to navigate to the pipeline and to a particular run of the pipeline (marked by #).
Tip: To add the Pipeline links column to the grid, use the Choose columns
 button.
-
-
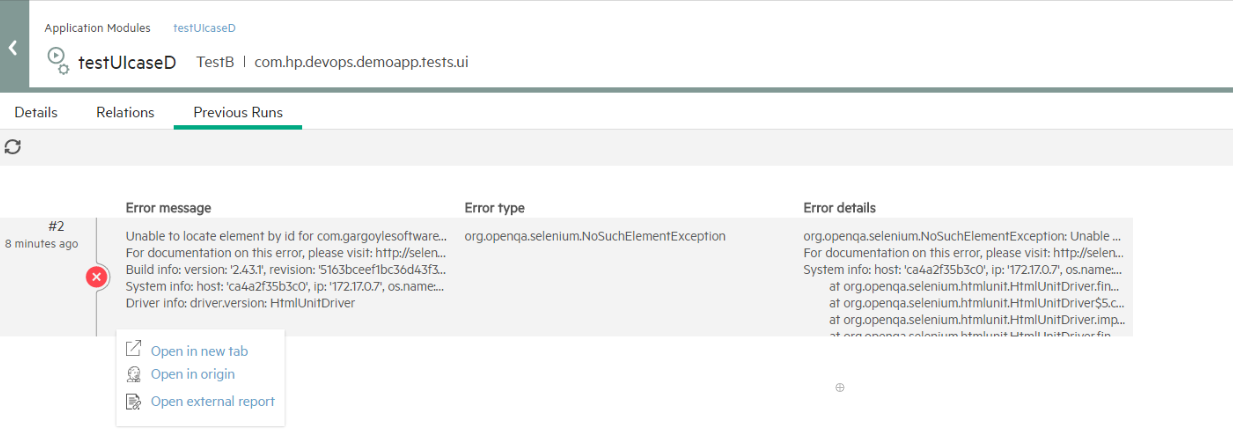
In the Error Info section, view the Error message, Error type, and Error details. The Error Info fields are only populated for failed test runs. If the error details are truncated in the fields, click Show all details to display the error details in full view in a new tab.
When a test fails, the failure cause (stack trace) is sent to the server. ALM Octane users can immediately see the reason.
-
On the top-right of the Details tab, click Show in <source> to view the test results in the CI server.
-
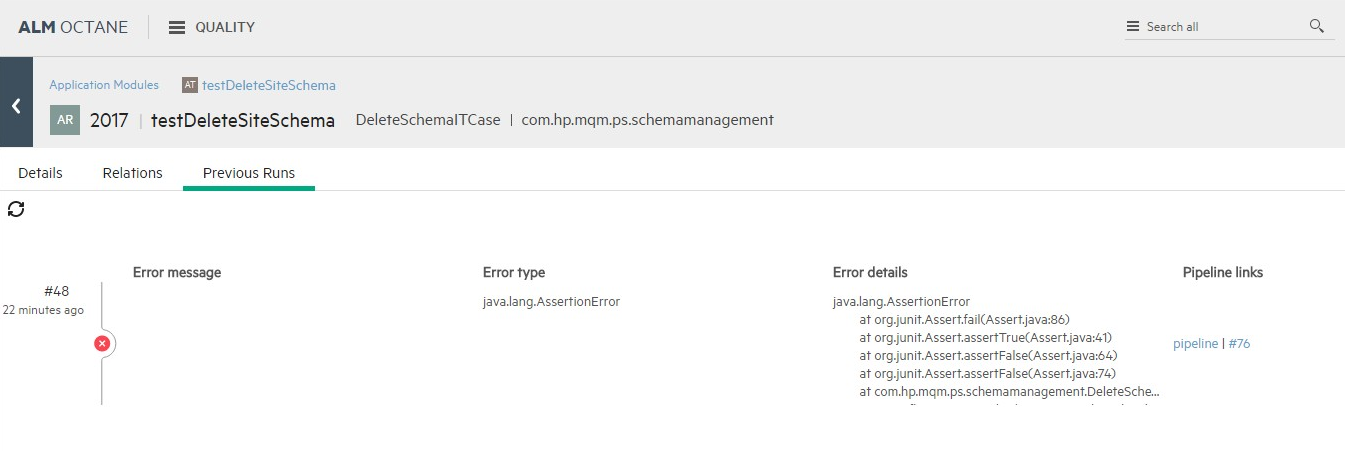
In the Previous Runs tab:
-
View a list of previous test runs and related build failure and error information, including message, exception, and stack trace.
-
Filter the run history per specified failure or error criteria. For example, you can filter by run status to view only failed runs so you can immediately identify and resolve them. You can also filter by time duration, build status, and substrings in error messages, exceptions, and stack traces.
-
In the tooltip of the previous run, click the Testing tool report link to navigate to the report in the external system that produced this run, when applicable.
-
Click the Pipeline links to navigate to the pipeline run (marked by #) and to the pipeline.
-
-
You can create a defect based on this run by clicking Report defect.
Examine test failures from a pipeline
For a pipeline-level analysis, use a pipeline run's Tests tab. For details, see Test run details.
Examine test results in an external tool
For LoadRunner Cloud tests, in the Tests tab, click the Testing tool report button to open the detailed report.
Examine overall automation test results
In addition to examining a single test's run results, it is possible to view overall status for all the automation test results.
To analyze test results for multiple automation test runs:
-
Ensure that ALM Octane has discovered and created the automation run results and tests. For details, see Add automated tests.
-
Access your run results, from:
Dashboard or Overview tabs of the Backlog and Quality modules Use any Dashboard widget used to assess quality through test run results.
In the Scope tab of these graphs, ensure that you add a filter using the Subtype attribute with a value of Automated Run.
In addition, add filters for to view automated tests from a specific Pipeline, or a specific Package, Component, or Class.
Pipelines module The main page of the Pipelines module displays per-pipeline information about all the automated tests included in that pipeline. This includes information about the application modules with failed tests, problematic tests in recent runs, and so forth.
Use this information to isolate the automated test run per pipeline and view these run as part of the product build.
 See also: