Share this page


Track code coverage in pipeline runs
This topic explains how to see data from your code coverage reports in ALM Octane.
Code coverage overview
ALM Octane can display code coverage data collected by JaCoCo (in XML format), or by other tools (LCOV format), or by fetching the coverage data collected by SonarQube, using its REST API. (This is only possible when SonarQube is integrated with Jenkins.)
If you do not have a Jenkins or GitLab CI server, it is still possible to inject JACOCO-XML or LCOV coverage report formats, by using a dedicated REST API.
To enable frequent releases with minimal disruption and maximum quality, it is best to regularly run automated tests that cover as much of your code as possible. Code coverage on pipeline runs measures the percentage of lines in your code that was called during a particular run of the pipeline.
ALM Octane combines the information from all of the code coverage reports in your pipeline run and shows you a unified picture. Pipelines display widgets that show code coverage per package and per file, as well as code coverage trends over time. Using this information, you can track how much of your code is covered by automated tests.
Tracking code coverage in ALM Octane is made up of the following:
| Step | Tool/format |
|---|---|
|
Configure code coverage reports |
|
| Send code coverage reports to ALM Octane |
|
| View code coverage information |
ALM Octane |

Get code coverage data from SonarQube
To view code coverage data in ALM Octane from SonarQube, you need to have a Jenkins job whose coverage is already displayed in SonarQube.
-
Create the integration as described in Set up an integration with SonarQube.
-
Set up the ALM Octane integration with your Jenkins server using the Application Automation Tools plugin. For details, see Set up CI/CD integration.
This feature requires version 5.7.2 or later of the plugin. This version is currently available as a beta version. If you are using an earlier version of the plugin, you can upgrade your plugin to this version.
-
Run the pipeline.
Get code coverage from Jenkins JaCoCo or LCOV
You can get code coverage data both from freestyle jobs and pipeline-as-code jobs.
Prerequisites: This integration requires standard industry tools such as Maven and JaCoCo generating code coverage JaCoCo or LCOV reports on your Jenkins server.
-
Set up the ALM Octane integration with your Jenkins server using the Application Automation Tools plugin. For details, see Set up CI/CD integration.
This feature requires version 5.3.1 or later of the plugin. If you are using an earlier version of the plugin, you can upgrade your plugin to this version.
-
-
Freestyle jobs: For pipeline steps whose code coverage you want to track on ALM Octane, create a post-build step that sends the code coverage reports to ALM Octane. Select the ALM Octane code coverage publisher post-build step, and provide the paths to your code coverage reports.
-
Pipeline-as-code: Within your pipeline script, add the step publishCodeCoverage: ALM Octane code coverage publisher, and provide the path to your code coverage reports. (You can use the Snippet Generator to see sample syntax.)
For example:
stage('Publish Coverage') {
publishCodeCoverage jacocoPathPattern: ' **/site/jacoco-unit-test-coverage-report/jacoco.xml ', lcovPathPattern: '**/coverage-reports/lcov.info'
}
-
-
Run the pipeline.
Get JaCoCo code coverage data from GitLab
To get JaCoCo code coverage data from GitLab, set up the integration between ValueEdge and ALM Octane and GitLab as described in ALM Octane GitLab CI service. The following section describes this procedure at a high level.
This feature requires version 1.1.126 or later of the service.
-
Configure the ALM Octane GitLab CI service as described in the readme file located in https://github.com/MicroFocus/octane-gitlab-service.
To get code coverage data, define the following property, as described in the readme file:
gitlab.codeCoverage.variables.generatedCoverageReportFilePathVarName.
-
In your GitLab project, configure a variable for the property, as described in the readme file.
View code coverage data in ALM Octane
ALM Octane receives all of the code coverage reports that belong to one pipeline run and aggregates them. You can then see an overall picture of the code coverage in your pipeline runs and determine whether the coverage is improving over time.
-
In the Pipelines > Pipelines page, add the code coverage widgets to the pipeline dashboard. The widgets show code coverage per package and per file, as well as code coverage trends over time.
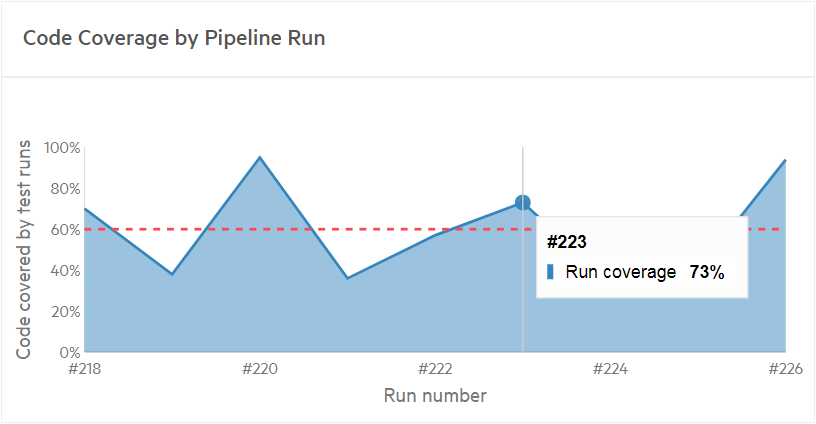
The Code coverage by pipeline run widget shows the overall percentage of code lines covered by automated tests in each pipeline run. Invest in developing automated tests for as much of your code as possible, aiming to develop and then maintain a high code coverage as your code base grows.
The Code coverage by package widget shows the code coverage per package in your code base, as well as the percentage of code lines covered by automated tests in each file. For more details, see The 'Code coverage by package' widget.
Tip: Use the widget configuration's Scope settings to define which package to view as the root of the chart. For example, a team leader might want to focus on the package that is relevant to their team rather than viewing the full product hierarchy.
-
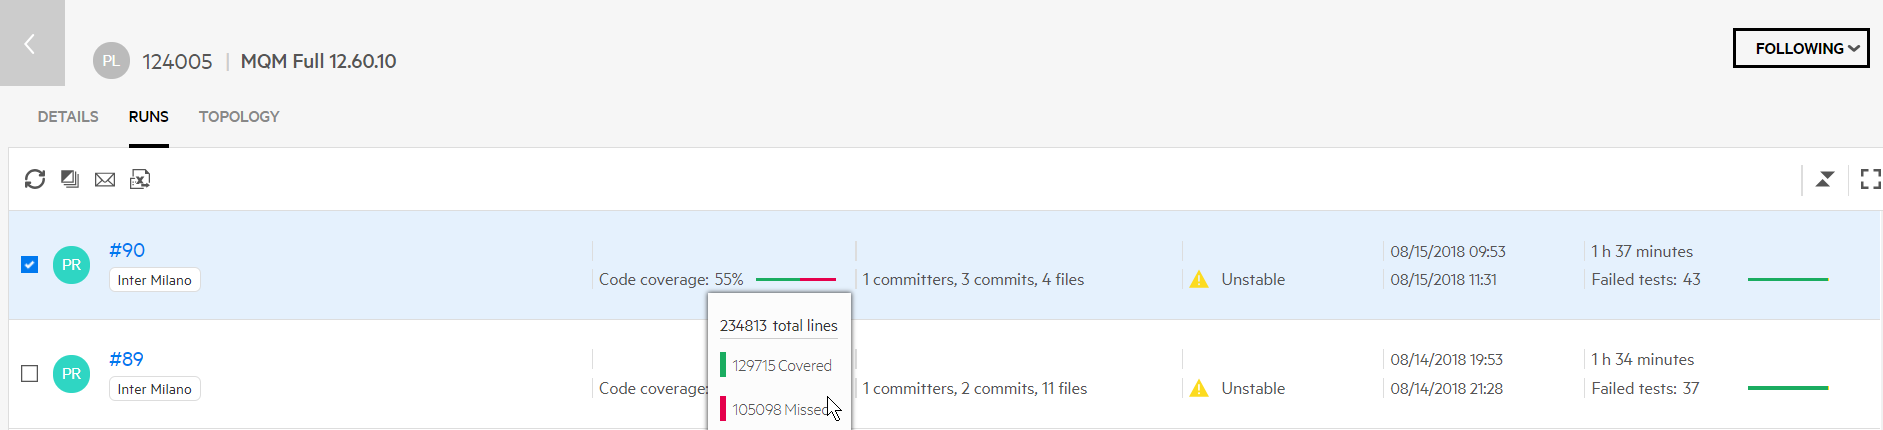
Click the pipeline's ID to open it.
In the Runs tab, you can see a code coverage bar on each pipeline run. Red represents the code lines that were not reached by any test runs. Green represents the code lines that were called at least once during the tests that ran as part of this pipeline run. Hover over the bar to see the exact numbers of files.
The 'Code coverage by package' widget
Use the Code coverage by package widget to quickly identify the largest areas in your code and the ones with the lowest code coverage. If important code packages are large and have low coverage, invest in creating more or better automated tests for those areas.
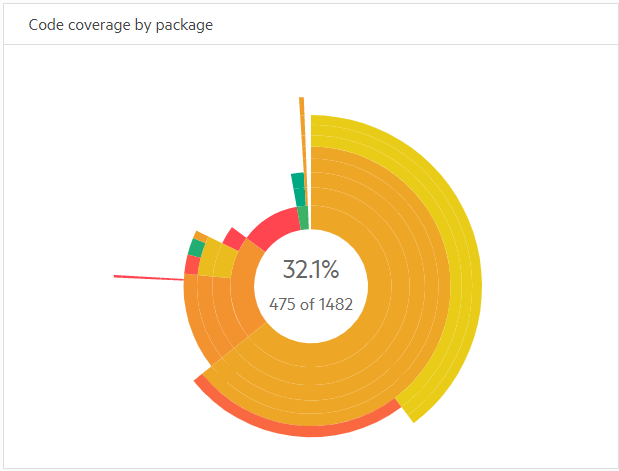
This widget is interactive and shows more information about the areas you hover over or click.
-
Each area in this sunburst chart represents a code package.
-
The size of each area indicates the amount of code lines in the package.
-
The color of the area represents the code coverage of this package. Red represents packages where no code lines were reached by any test runs. Green represents 100% code coverage. The colors and shades in between represent the range of code coverage percentage.
-
The circles represent the code package hierarchy, with the high-level packages closer to the center of the chart.
Hover over an area to see the package name and the code coverage percentage.
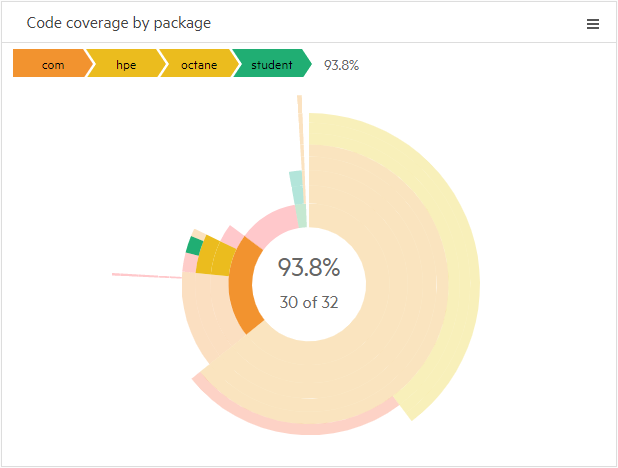
-
The outer rim of the chart represents code packages at the bottom of the hierarchy, which contain files. Click on areas in the outer rim to open a heatmap that shows coverage details per file.
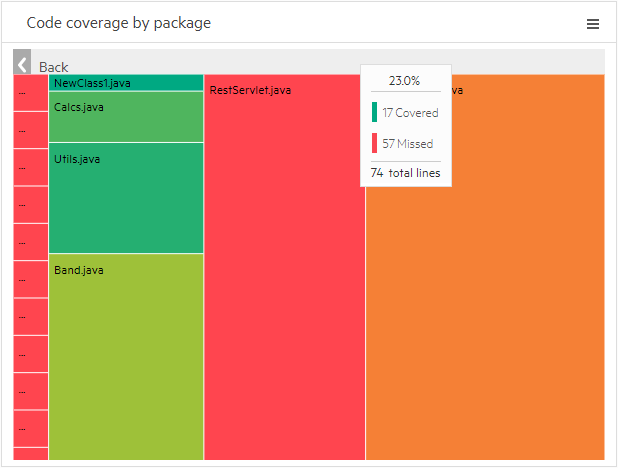
-
Each area in the heatmap represents a file in the selected package.
- The size of an area indicates the amount of code lines in the file.
- The color of the area represents the level of code coverage.
- Hover over an area to see the exact number of lines and code coverage percentage.
 See also: