Operational Reporting Diagrams
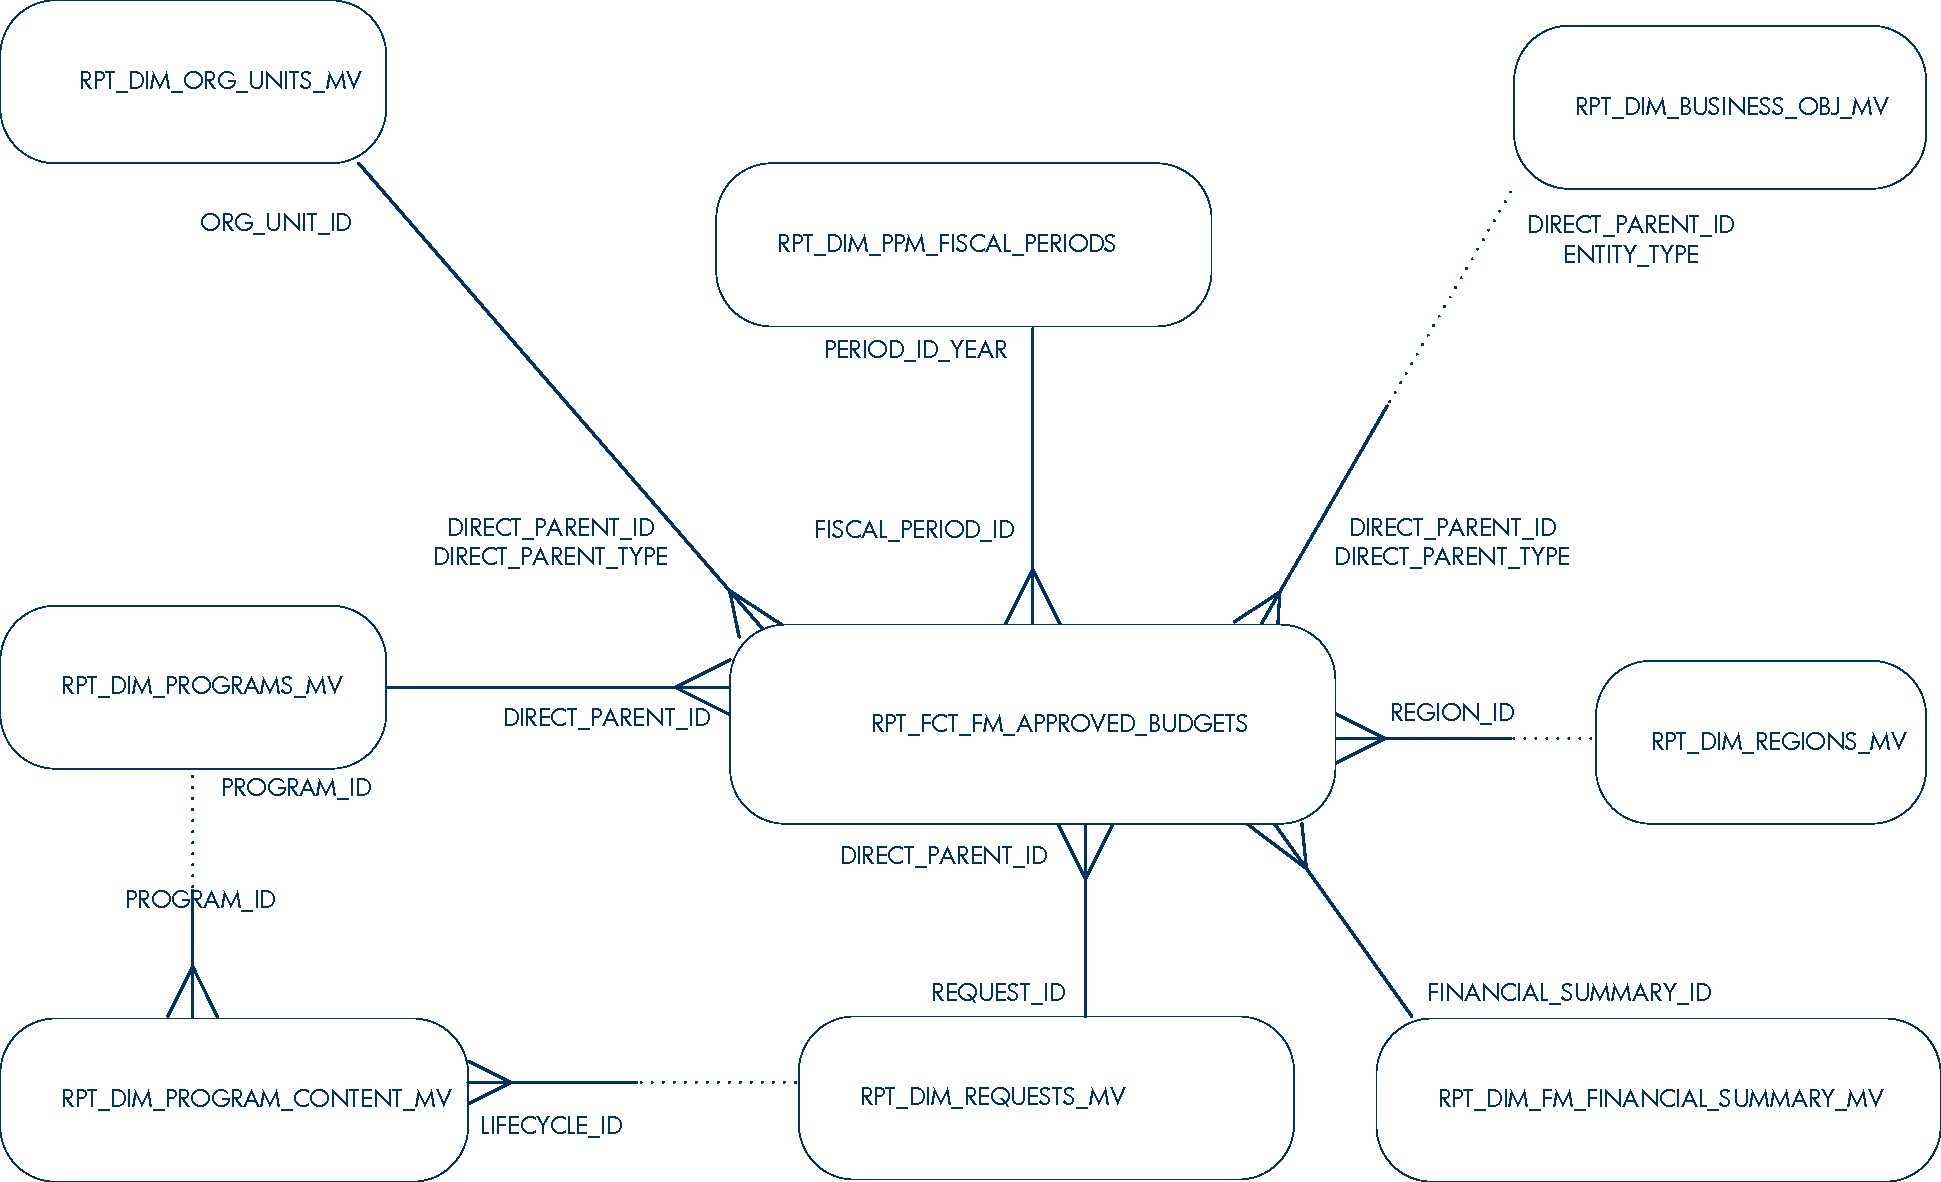
- Figure 2-52. Approved budget
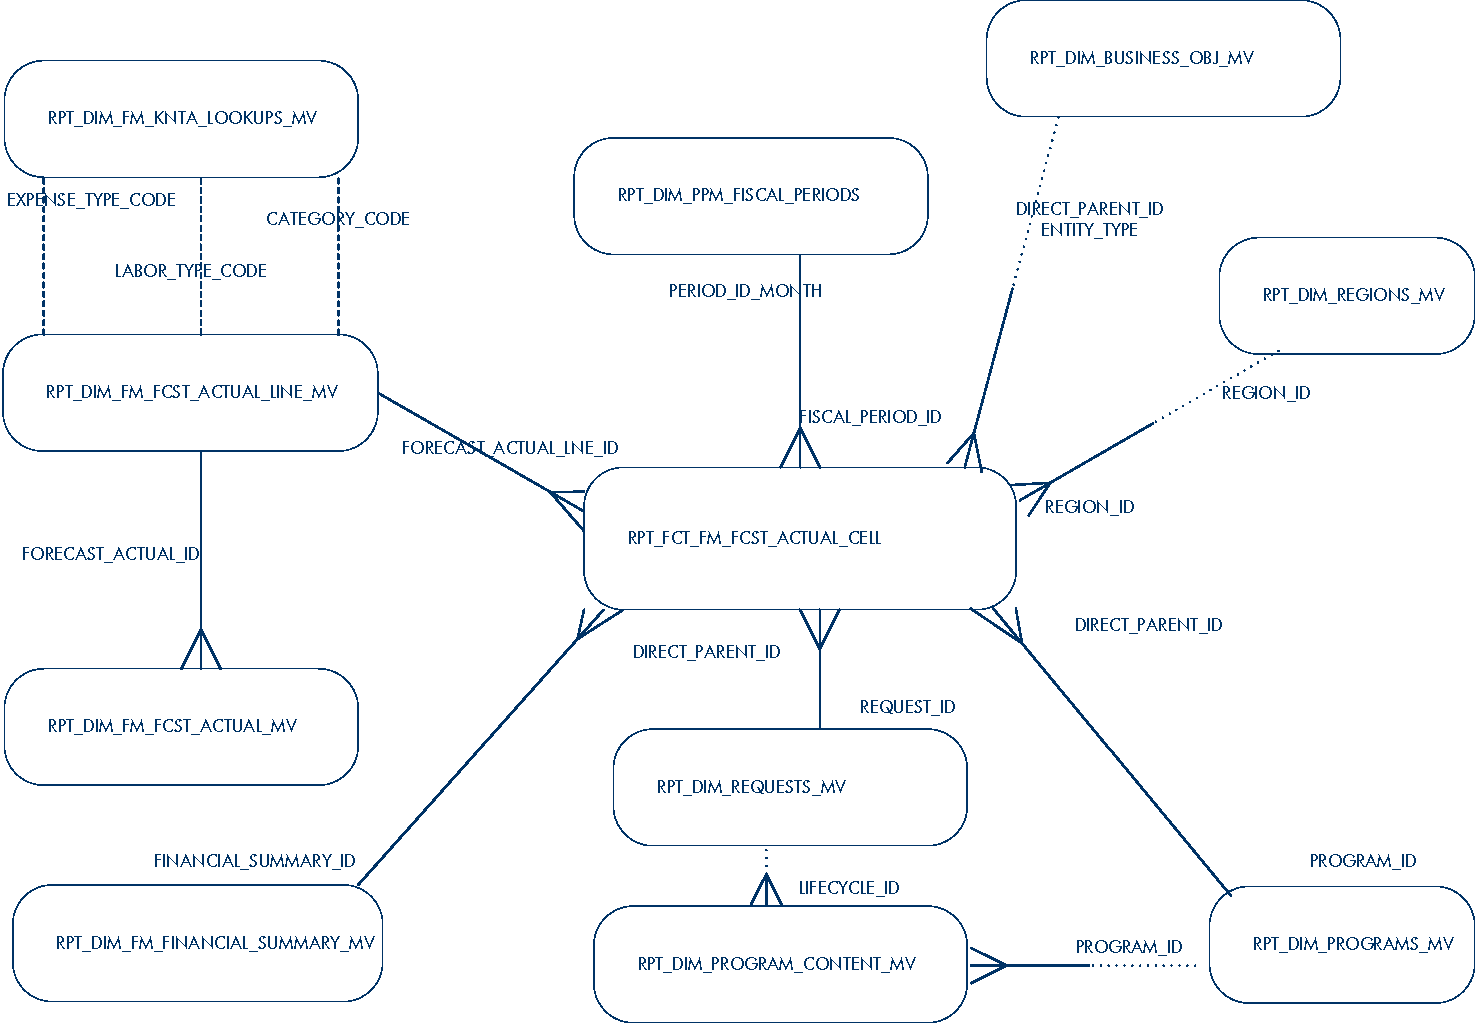
- Figure 2-53. Forecast and actual
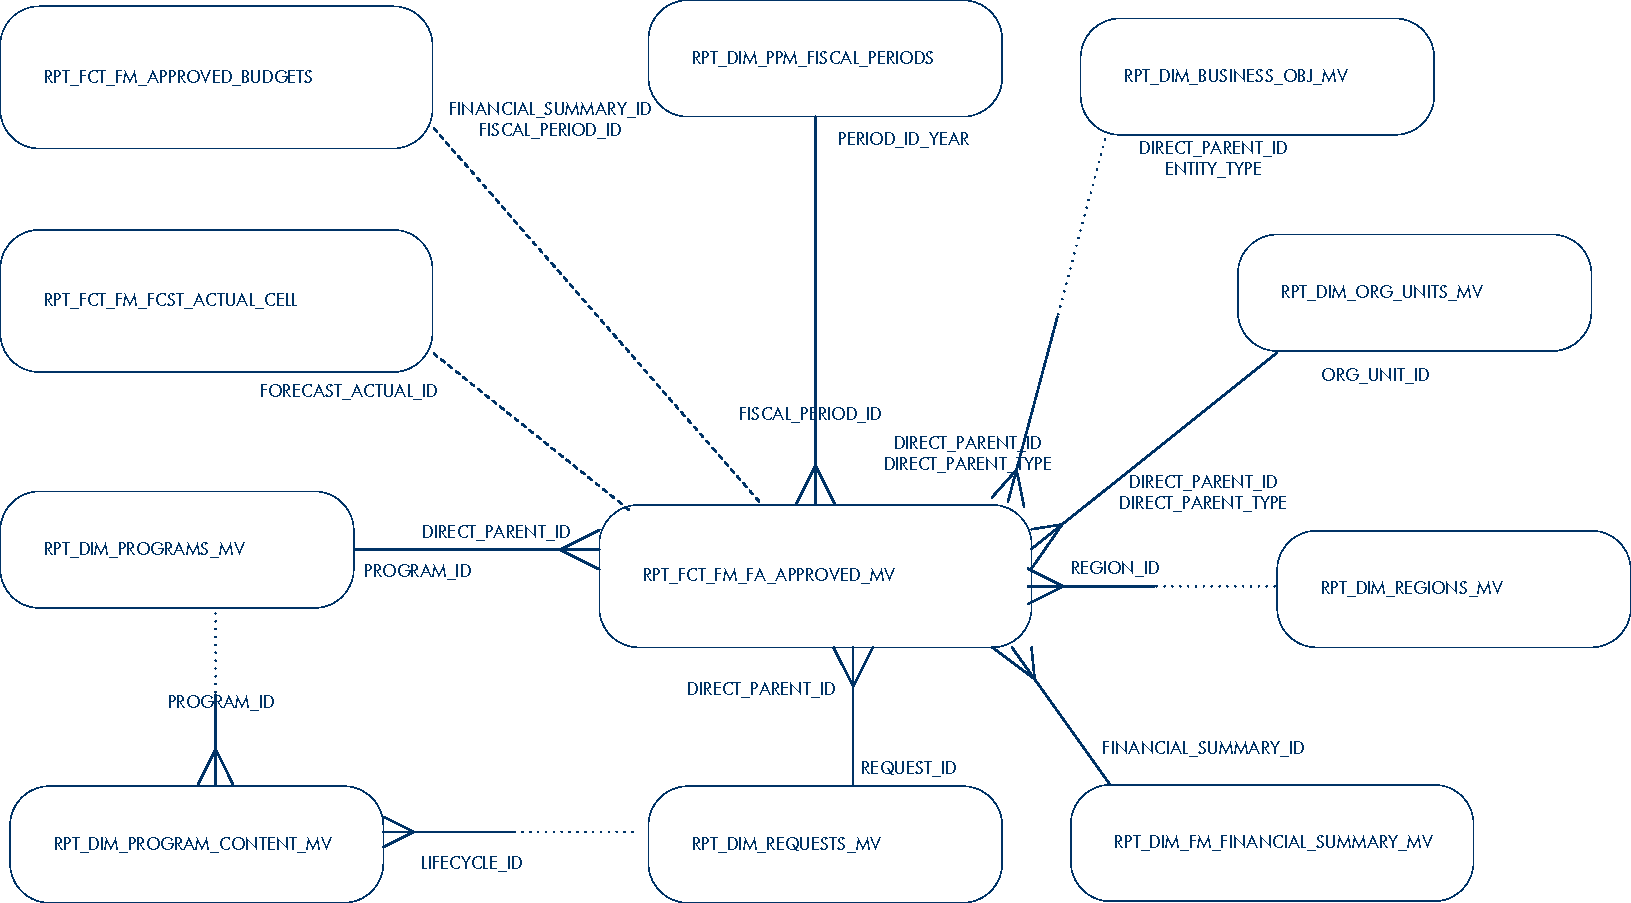
- Figure 2-54. Forecast, actual, and approved budget
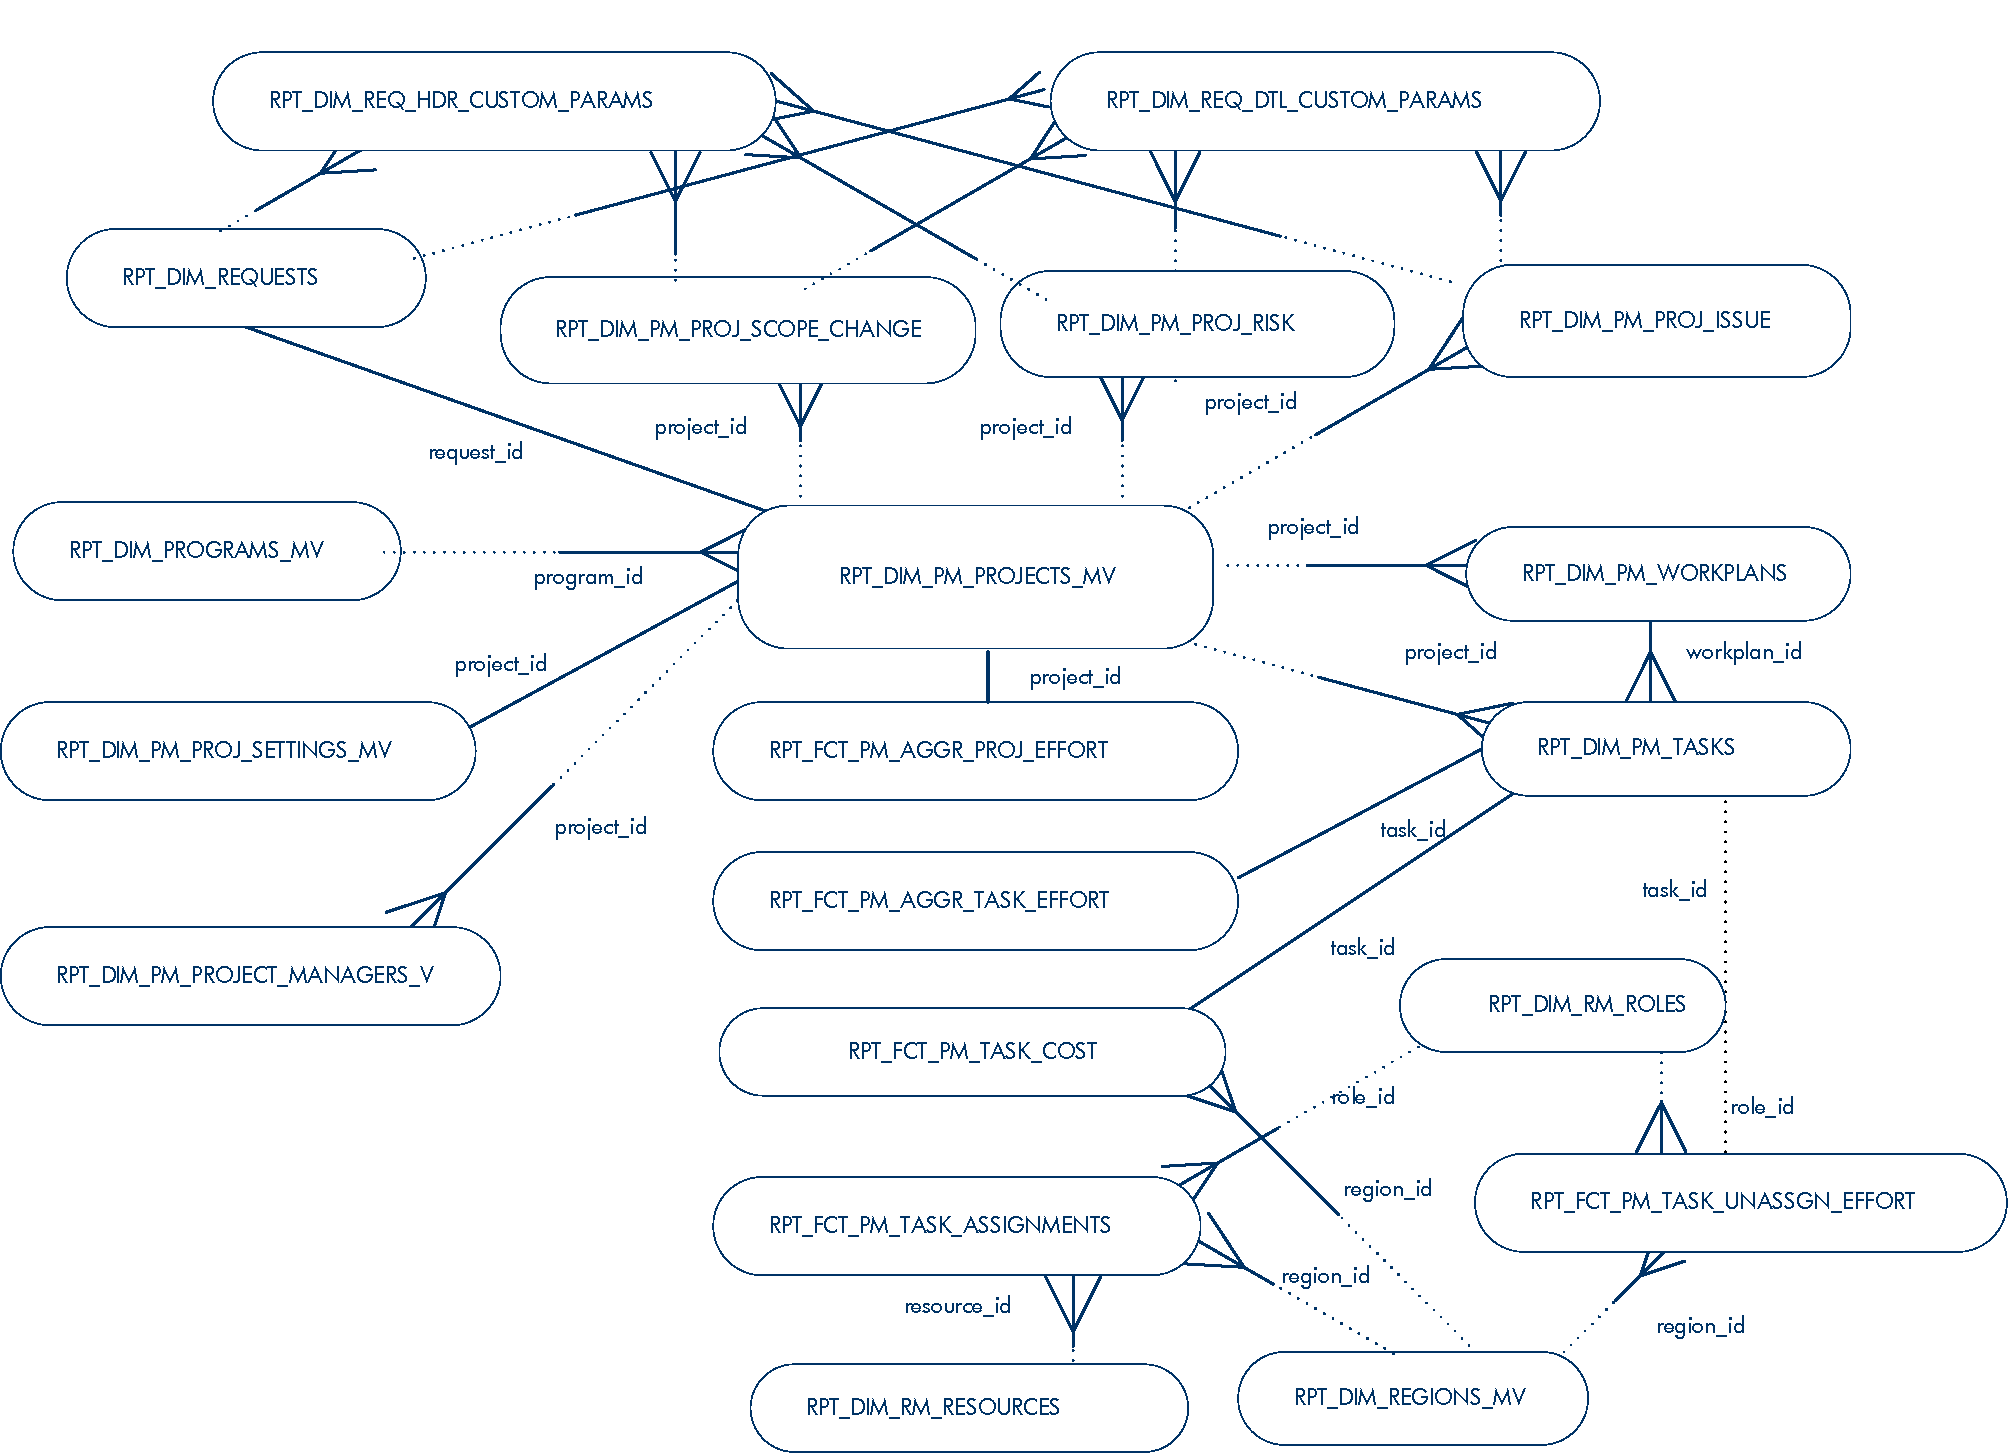
- Figure 2-55. PM Universe
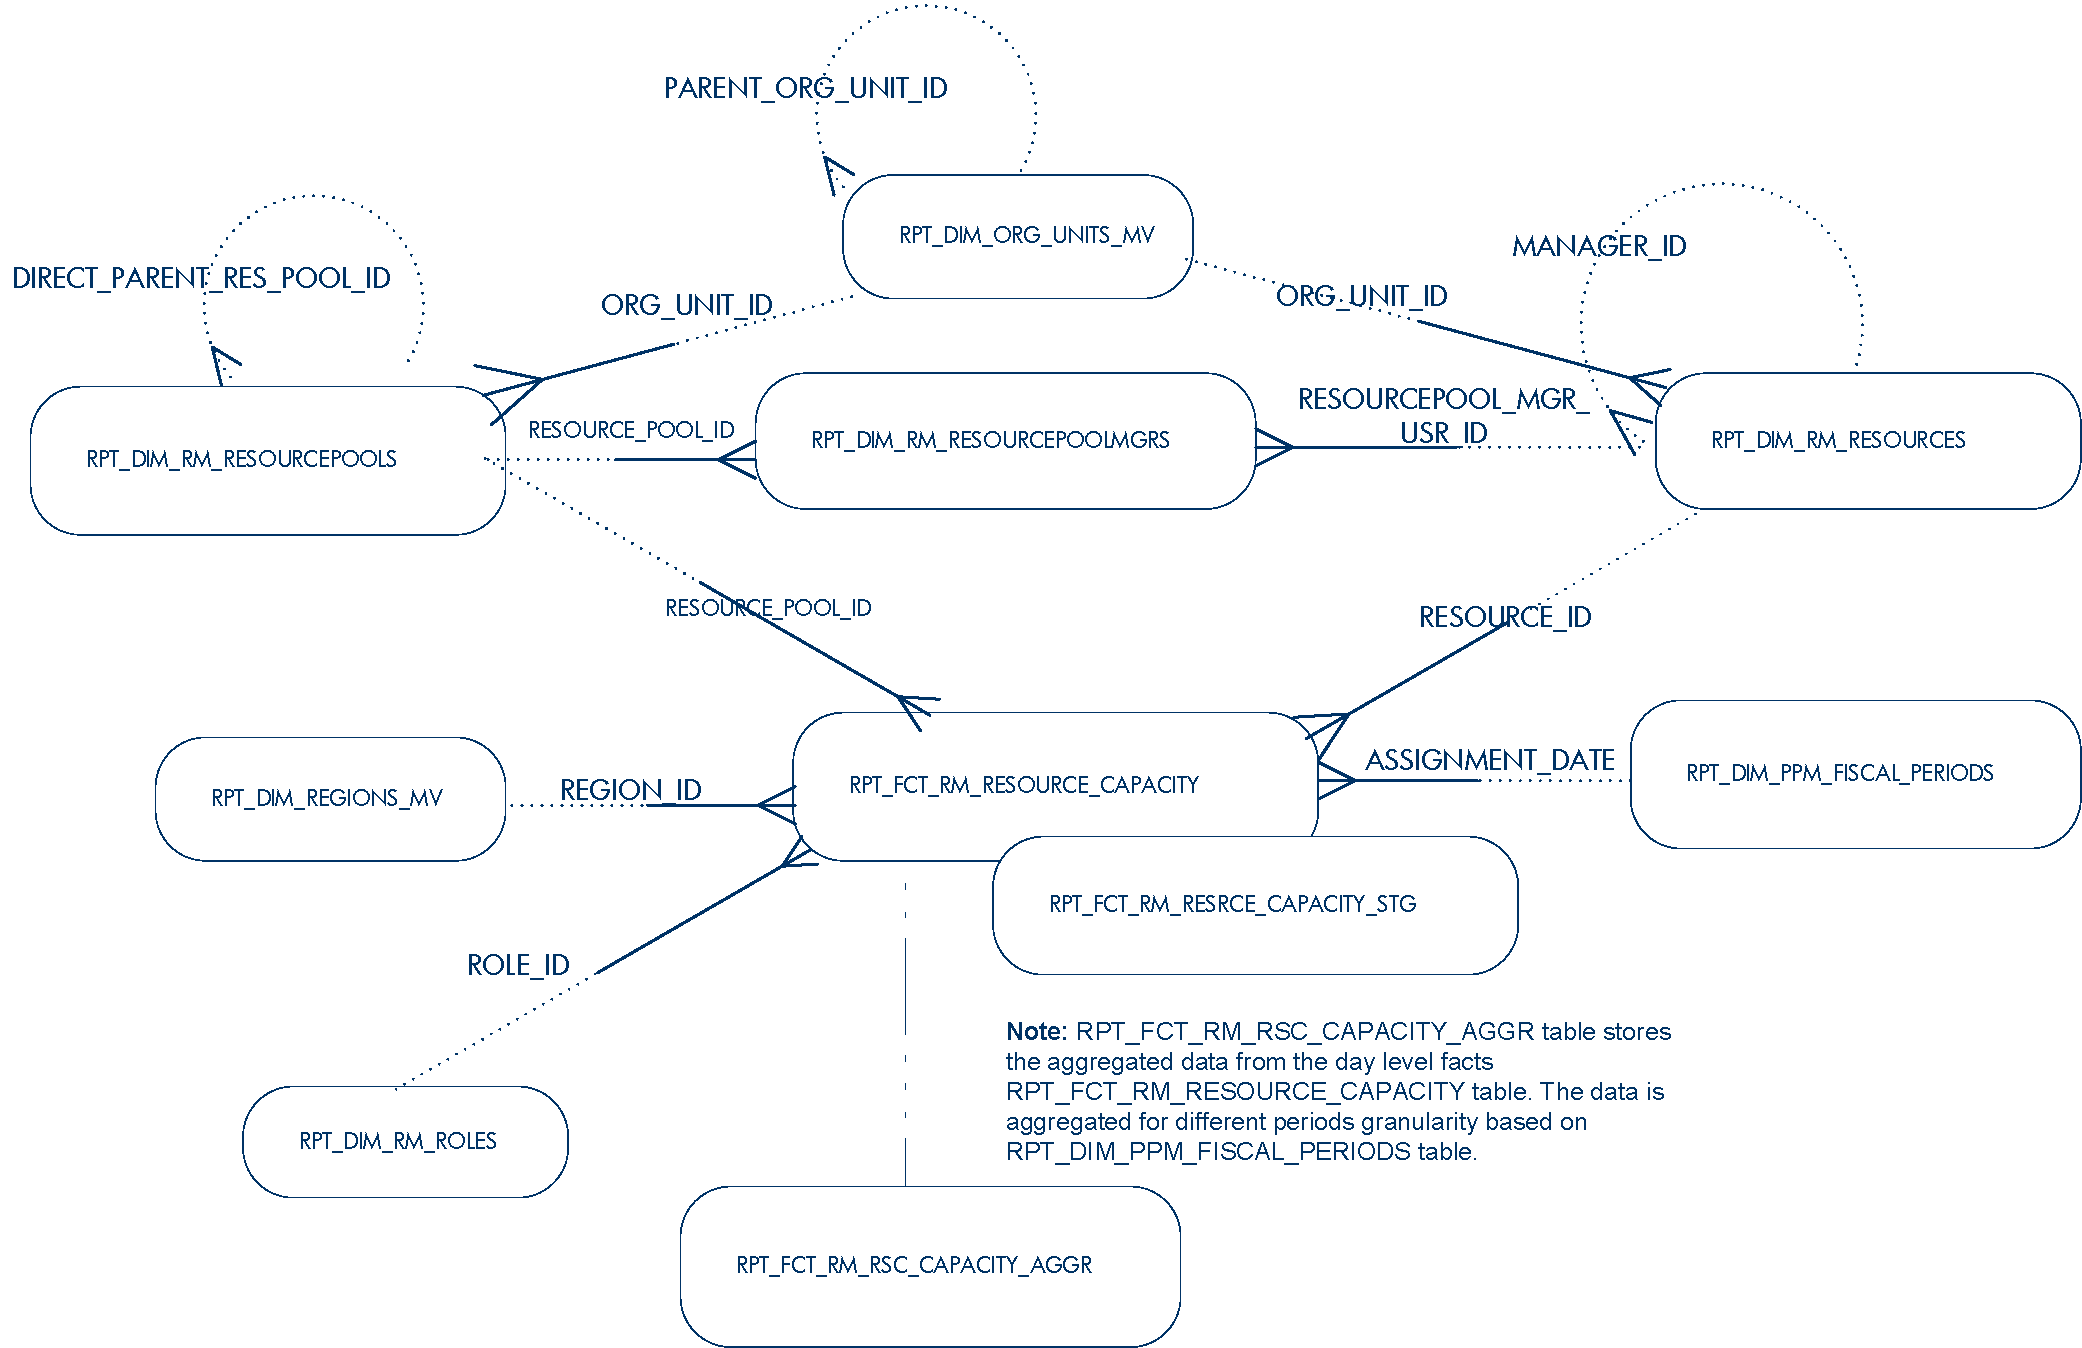
- Figure 2-56. Resource capacity
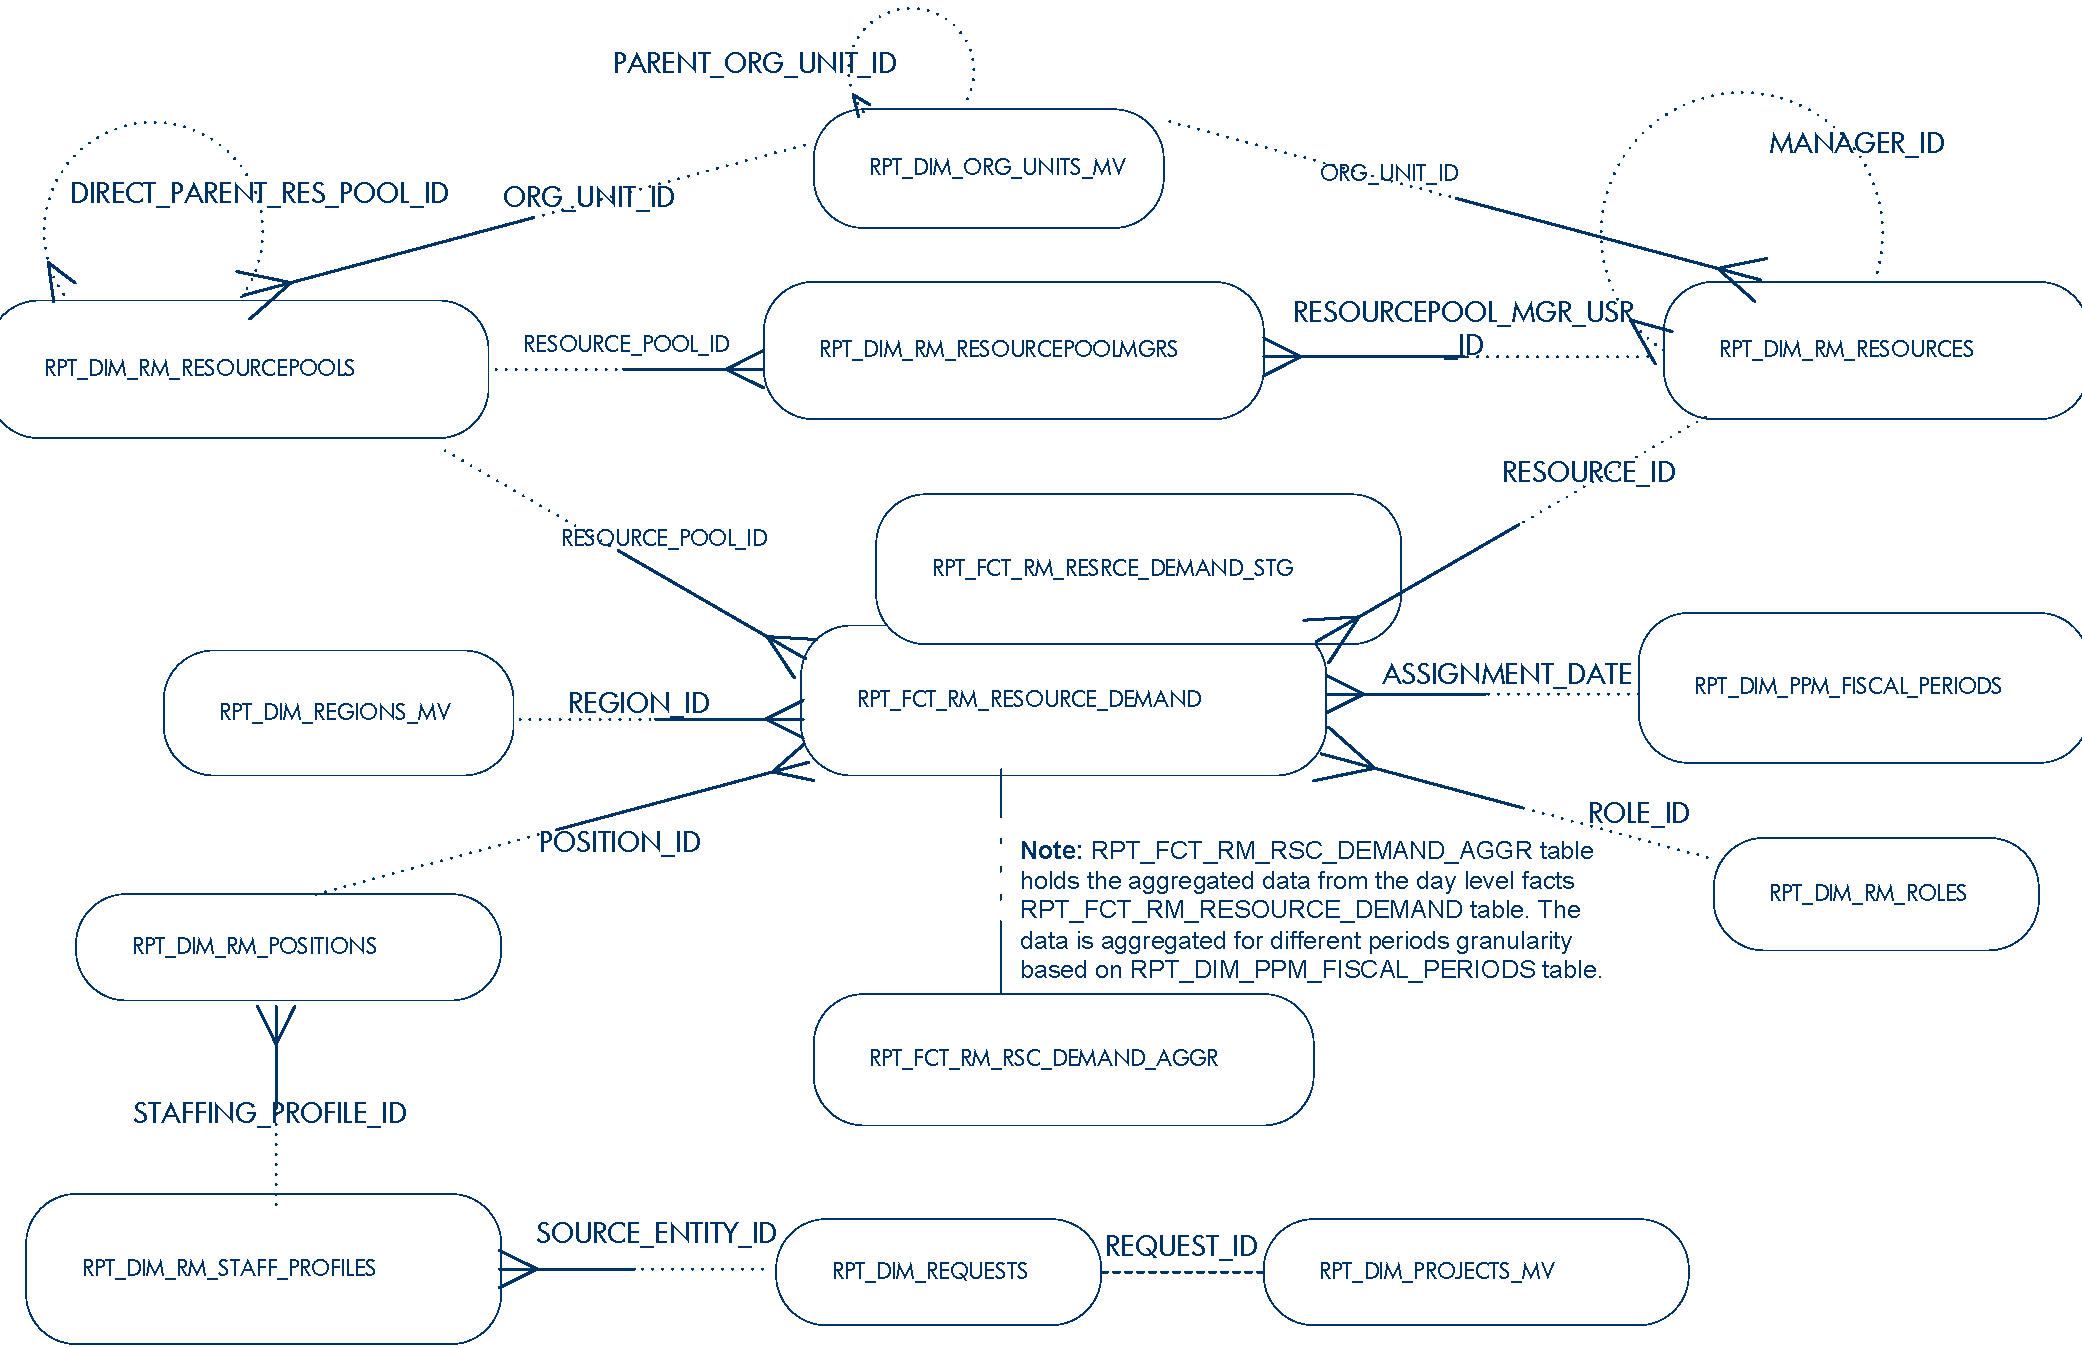
- Figure 2-57. Resource demand
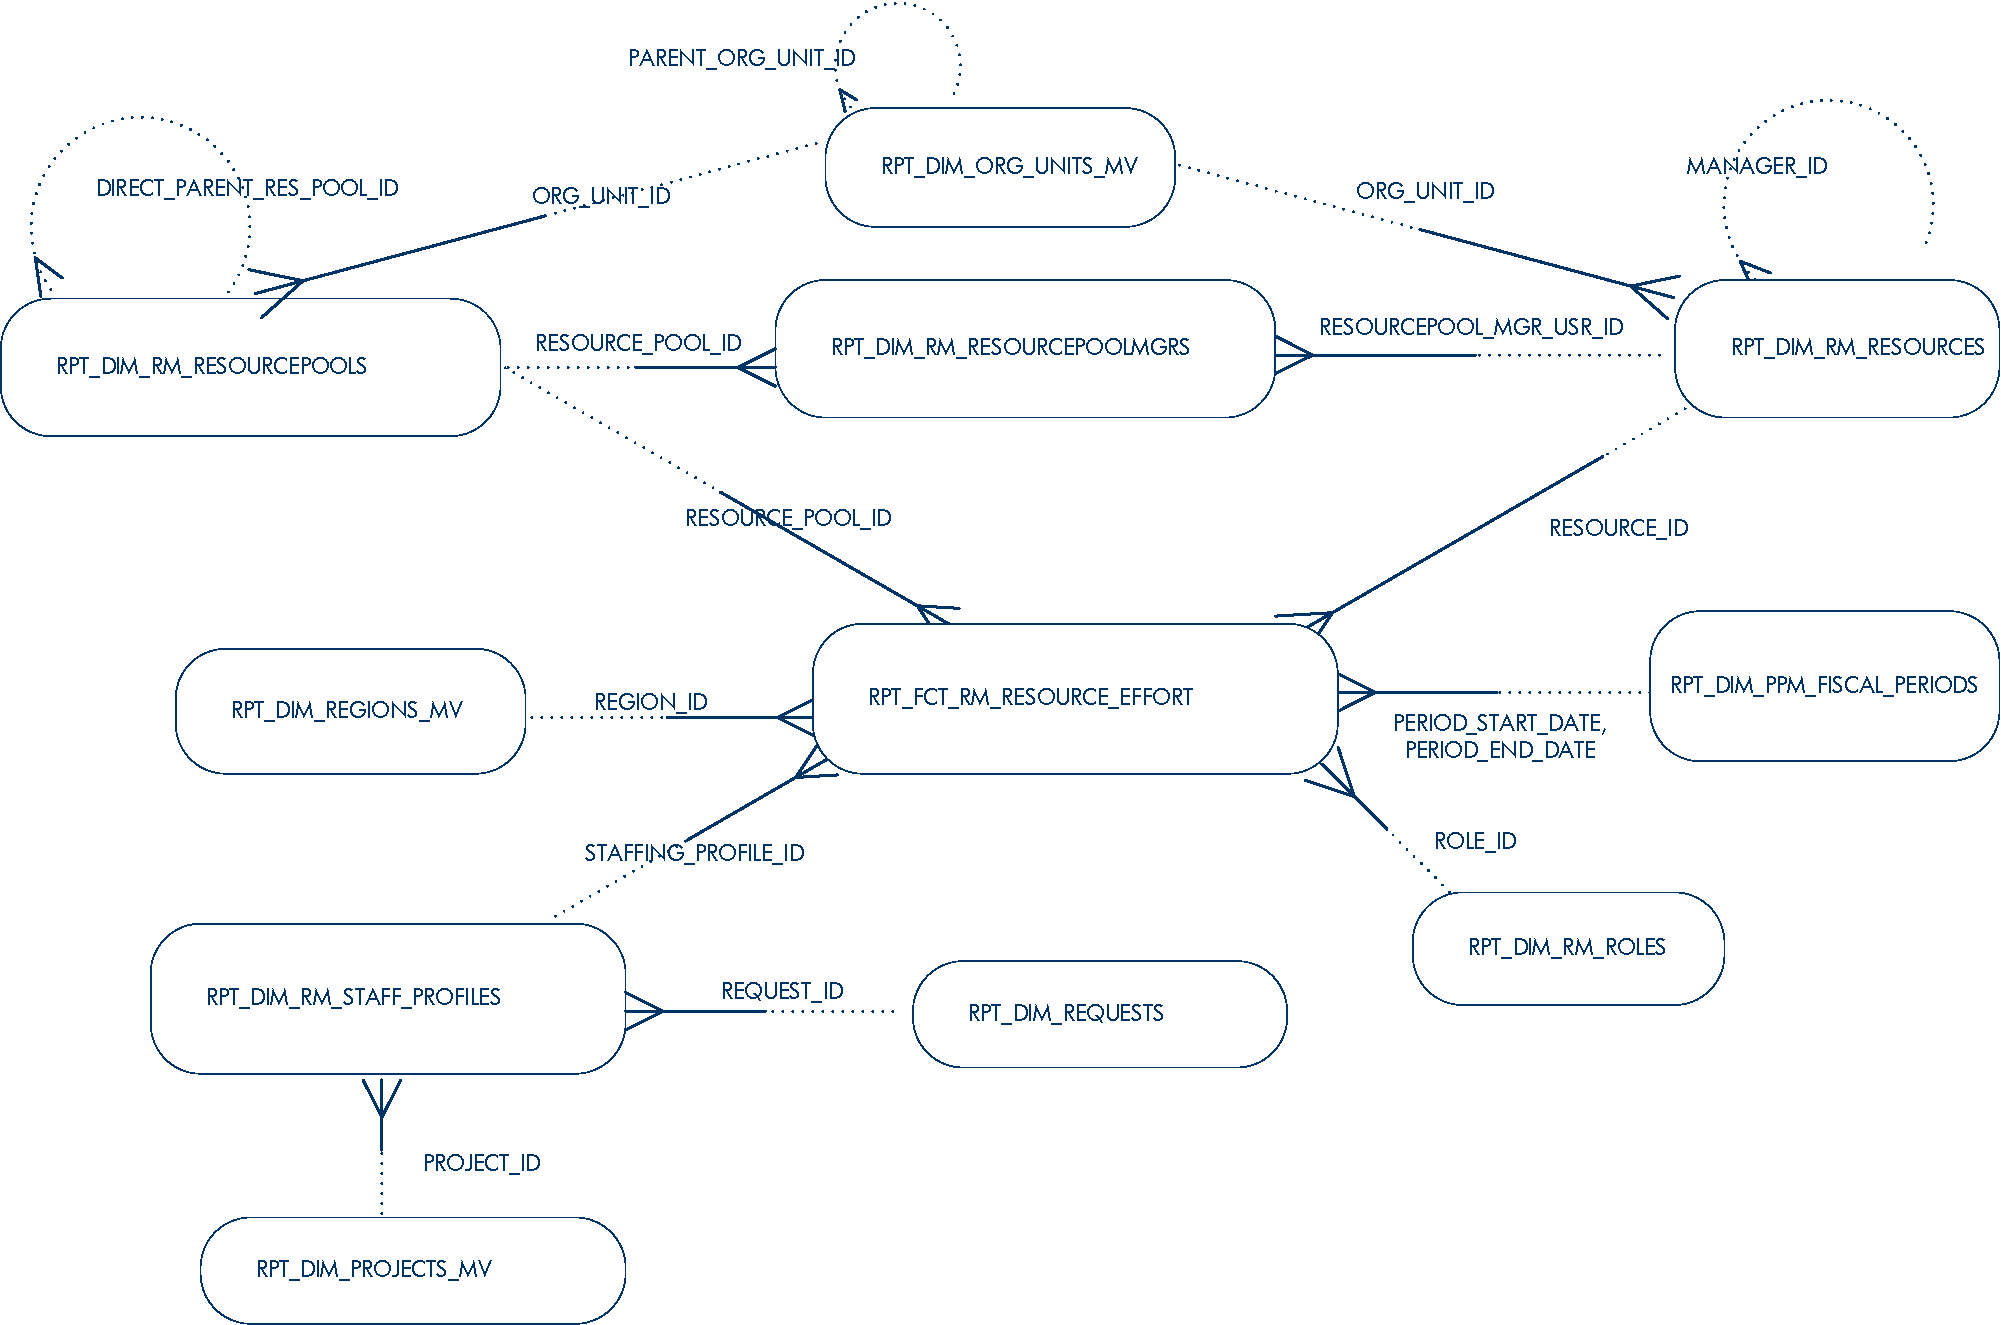
- Figure 2-58. Resource effort
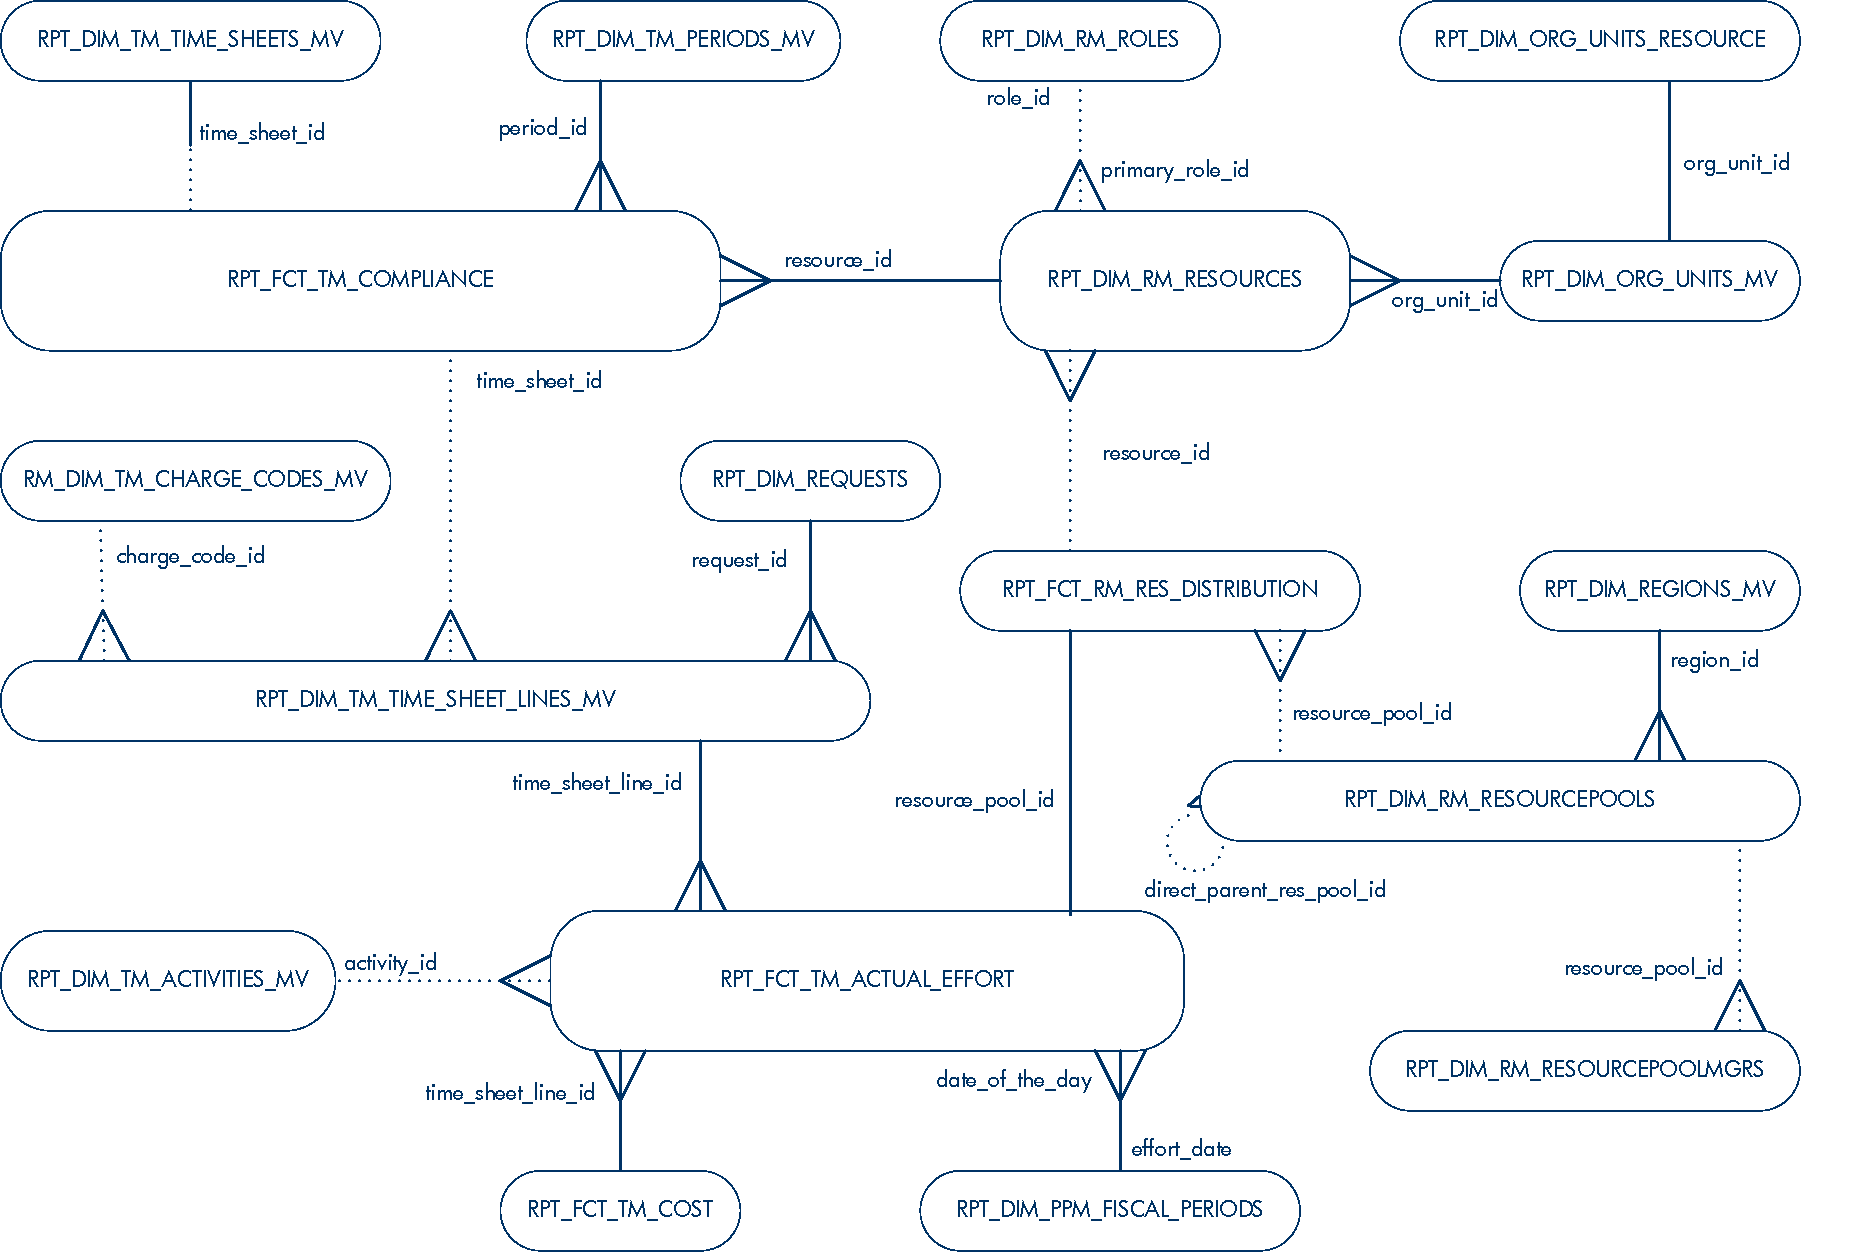
- Figure 2-59. Time management
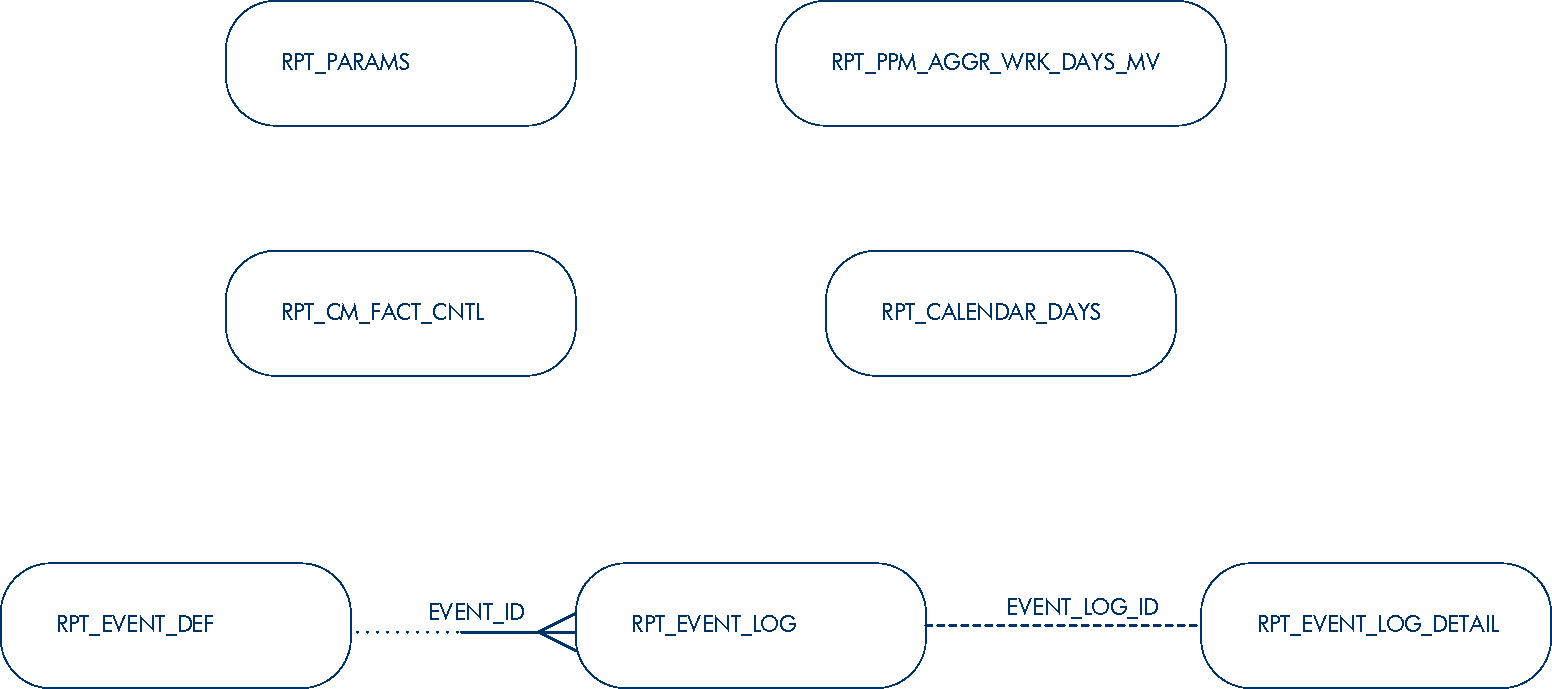
- Figure 2-60. Other tables used during processing
