
Share this page


Tracing PPM Pages with the Debug Console
The Debug Console helps locate the poor SQL executions that may cause performance issues. For example, if you find a page slow, you can open the Debug Console, locate the slow page, collect information from Oracle side about the SQLs executed on this page, and save the information. With the information, software support can identify performance bottlenecks and provide suggestions on how to tune the performance.
Note: Debug Console works by identifying and tracking threads that handle HTTP requests. It cannot capture information for the actions that happen outside the main threads that the Web server uses to handle HTTP requests. For example, in the Demand Management module, special commands are handled by threads spawned by request-handling threads, thus they would not be captured by the Debug Console.
To use Debug Console:
- Prerequisite: the parameter
SHOW_DEBUGGING_CONSOLE_PER_USER=trueis added in theserver.conffile. - Open a PPM page.
-
Hold the
ALTkey and click the product acronym in the front of the menu bar.
-
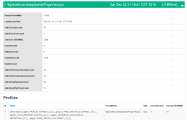
Click Debug Console in the bottom-right corner of the page.
A new window opens listing all the pages you have requested in your current session.
-
Expand the page record that you find slow to view SQLs executed on this page.

To close Debug Console, hold the ALT key and click the product acronym again.

