View financial totals from financial summary
This section describes how to view financial totals in a financial summary.
In this topic:
View totals over financial summary's entire periods
The Summary section of an entity's financial summary shows the entity's financial totals over the financial summary's entire range of periods.
Use the Display Currency in toggle to show the totals in either base currency or local currency. For details, see Display Currency in.

|
Field |
Description |
|---|---|
|
Total Forecast Cost a |
Total forecast (planned) costs over the entity's entire range of periods. = Forecast Labor Cost + Forecast Non-Labor Cost For details about how PPM calculates forecast cost, see How PPM calculates forecast and actual cost. |
|
Total Forecast Benefit a |
Total forecast (planned) benefits over the entity's entire range of periods. |
| Projected Cost |
Total cost required to complete the entity. It is estimated based on the current progress. Projected Cost = cost of each previous month + cost of the current month + cost of each future month By default:
However, if the
Note: For each program: Projected Cost = Projected Cost (roll-up) + Projected Cost (editable)
|
|
Net present value (NPV) is total nominal return, discounted to its current value, based on a specified discount rate and the time allowed for the nominal return to be realized. PPM calculates and reports total NPV, which is the sum of these values for all months—previous, current, and future—using each month's particular Nominal Return. NPV for past and current months is meaningful for projects that are underway. Only future months are discounted. Previous and current months use their Nominal Return values in calculating the sum. NPV is calculated using actual and forecast costs and benefits from all the months of the financial summary. For any particular future month: NPV = (Nominal Return) / (1 + i/12) n
Note: For each program: NPV = NPV (rollup) +NPV (editable)
|
|
|
Total Approved Budget b |
Sum of all approved budget in the financial summary. |
|
Total Actual Cost a |
Total actual costs over the financial summary's entire range of periods. =Actual Labor Cost + Actual Non-Labor Cost For details about how PPM calculates actual cost, see How PPM calculates forecast and actual cost. |
|
Total Actual Benefit a |
Total actual benefits over the financial summary's entire range of periods. |
|
Total Nominal Return a |
Nominal Return represents the total nominal return over the financial summary's entire range of periods. The Total Nominal Return is calculated over the entire time range. Total Nominal Return = Total Benefits - Total Costs To determine total costs and total benefits over the entire time range, monthly contributions are based on values for each individual month, as follows:
Note: For a program, Total Nominal Return is the program content's total cost subtracted from the program content's total benefit. |
| Remaining Forecast Cost | Remaining Forecast Cost = Forecast cost of the current month + Forecast cost of each future month |
|
a. These metrics include all of the data in the financial summary, which can extend beyond the time range that can be displayed. These metrics also include all existing phases of the lifecycle entity, that is, the lifecycle entity as it might have progressed from proposal to project to asset. b. Total Approved Budget includes all of the approved budget data in the financial summary. You can display data for each of the fiscal years for which data exists. Total Approved Budget also includes all existing phases of the lifecycle entity, although it is typically used only for projects. |
|
View totals by year
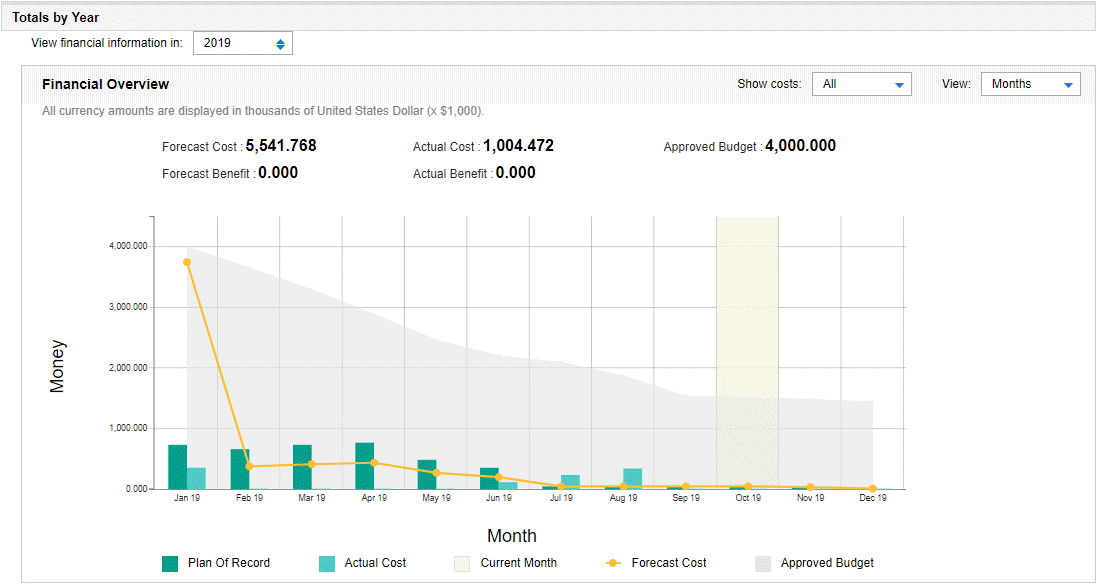
The Totals By Year section of an entity's financial summary allows you to see the following financial totals of a selected fiscal year.
- Forecast Cost
- Actual Cost
- Forecast Benefit
- Actual Benefit
- Approved Budget

| View financial information in |
Select in which fiscal year you want to view the financial totals. Your PPM administrator can configure the range of fiscal years that is displayed in this field. For details, see Configure range of fiscal years. |
| Show Costs |
The field appears only if cost capitalization is enabled. For details, see Enable cost capitalization. It has the options: All, Capital, and Operating. If you select Capital or Operating, the graph and the Forecast Cost, Actual Cost, and Approved Budget fields below the graph display only capital or operating costs accordingly. |
| View | Select to display financial totals by month or quarter. |


