
Share this page


Analyzing the Portfolio
The Analyze Current Portfolio page displays a bubble chart as a simple and powerful tool for viewing the portfolio in different ways. Depending on how you specify its filter fields, selected aspects of the portfolio can be displayed or hidden.
To view and analyze the portfolio:
-
From the menu bar, select Open > Portfolio Management, and in the top right corner click
 .
. -
Specify filter fields as described in Table 4-1. Analyze Current Portfolio page filter fields to configure the content and appearance of the bubble chart as needed.
By default, the bubble chart will display no proposals and all currently active projects and assets in the portfolio, with no restrictions, so that you can view the collection of projects and assets and assess their relative Value and Risk.
The last four fields provide versatile sets of options to control the fundamental purpose and appearance of the bubble chart. The other fields control which lifecycle entities are included in the bubble chart, one for each bubble. For example, by filtering on a Business Unit, you can view the portfolio of a particular business unit using all your other criteria.
-
Click Apply to apply the filters you selected.
If you select more lifecycle entities than are allowed, a message appears to add more filter criteria.
The bubble chart is displayed, and the choices you made for some of the filter criteria, such as Size of bubble indicates and Color of bubble indicates, are listed above the chart.
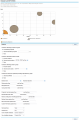
Table 4-1. Analyze Current Portfolio page filter fields Field Name
Description
Include the following proposals in graph
Selects proposals to display in the bubble chart—all proposals, particular proposals you select, or no proposals.
Include the following projects in graph
Selects projects to display in the bubble chart—all projects, particular projects you select, or no projects.
Include the following assets in graph
Selects projects to display in the bubble chart—all assets, particular assets you select, or no assets.
Include items from these portfolios (including subportfolios) in graph
Selects hierarchical portfolios to display all their lifecycle entities in the bubble chart, or selects no portfolios. For information about hierarchical portfolios, see Create and configure your portfolio.
To assist you in selecting particular hierarchical portfolios, the auto-complete displays their names, the names of their parent portfolios where applicable, and their portfolio managers.
The bubble chart displays a bubble for each of the individual lifecycle entities in each hierarchical portfolio you select, including the lifecycle entities in all of the hierarchical portfolios' subportfolios and programs.
If you select a particular lifecycle entity (by using one of the three preceding fields) and you select a hierarchical portfolio that includes it, the lifecycle entity is displayed only once in the bubble chart.
Business Unit
Filters the lifecycle entities by one or more particular business units.
Business Objective
Filters the lifecycle entities by one or more particular business objectives.
Project Class
Filters the lifecycle entities by one or more particular project classes.
Asset Class
Filters the lifecycle entities by one or more particular asset classes.
Value greater than <X> and less than <Y>
Filters the lifecycle entities by a range of Value Ratings you specify, as described in Determining Value and Risk Ratings.
Risk greater than <X> and less than <Y>
Filters the lifecycle entities by a range of Risk Ratings you specify, as described in Determining Value and Risk Ratings.
Score greater than <X> and less than <Y>
Filters the lifecycle entities by a range of Total Scores you specify, as described in Determining Value and Risk Ratings.
Projected Cost total greater than <X> and less than <Y>
Filters the lifecycle entities by a range of total projected cost you specify, calculated as the sum of the following:
-
For each previous month, actual costs where reported (that is, where not blank or zero), otherwise forecast costs
-
For the current month, the higher of forecast cost and, if reported, actual cost
-
For future months, the forecast costs
Benefit total greater than <X> and less than <Y>
Filters the lifecycle entities by a range of financial benefits you specify, calculated as the sum of the following:
-
For each previous month, actual benefits where reported (that is, where not blank or zero), otherwise forecast benefits
-
For the current month, the higher of forecast benefit and, if reported, actual benefit
-
For future months, the forecast benefits
Resource total (person months) greater than <X> and less than <Y>
Filters the lifecycle entities by a range of their staffing profiles' resource totals you specify (in person months).
Nominal return greater than <X> and less than <Y>
If this field is displayed, filters the lifecycle entities by a range of nominal returns you specify. Nominal Return is calculated as described in Total Nominal Return.
Net Present Value greater than <X> and less than <Y>
If this field is displayed, filters the lifecycle entities by a range of NPV you specify. NPV is calculated as described in Net Present Value (NPV).
Custom Field Value greater than <X> and less than <Y>
If this field is displayed, filters the lifecycle entities by a range of Custom Field Value you specify. Custom Field Value is configured for your specific PPM installation. For more information, see the Portfolio Management Configuration Guide.
Horizontal Axis
Specifies the parameter used for the bubble chart's horizontal axis. Options are as follows:
-
Value. Value Rating of the lifecycle entity, as described in Determining Value and Risk Ratings. This is the default option.
-
Risk. Risk Rating of the lifecycle entity, as described in Determining Value and Risk Ratings.
-
Score. Total Score of the lifecycle entity, as described in Determining Value and Risk Ratings.
-
Projected Cost. Projected cost of the lifecycle entity.
-
Benefit. Financial benefit of the lifecycle entity.
-
Resource. Staffing profile of the lifecycle entity.
-
Nominal Return. If enabled, nominal return for the lifecycle entity, calculated as described in Total Nominal Return.
-
Net Present Value. If enabled, net present value (NPV) for the lifecycle entity, calculated as described in Net Present Value (NPV).
-
Custom Field Value. If enabled, Custom Field Value of the lifecycle entity, as described in the Portfolio Management Configuration Guide.
Vertical Axis
Specifies the parameter used for the bubble chart's vertical axis. Options are as follows:
-
Risk. Risk Rating of the lifecycle entity, as described in Determining Value and Risk Ratings. This is the default option.
-
Value. Value Rating of the lifecycle entity, as described in Determining Value and Risk Ratings.
-
Score. Total Score of the lifecycle entity, as described in Determining Value and Risk Ratings.
-
Projected Cost. Projected cost of the lifecycle entity.
-
Benefit. Financial benefit of the lifecycle entity.
-
Resource. Staffing profile of the lifecycle entity.
-
Nominal Return. If enabled, nominal return for the lifecycle entity, calculated as described in Total Nominal Return.
-
Net Present Value. If enabled, net present value (NPV) for the lifecycle entity, calculated as described in Net Present Value (NPV).
-
Custom Field Value. If enabled, Custom Field Value of the lifecycle entity, as described in the Portfolio Management Configuration Guide.
Color of bubble indicates
Specifies what the various colors of the bubbles (lifecycle entities) represent, as indicated in the legend below the bubble chart. Options are as follows:
-
Business Objective. This is the default option.
-
Asset Class.
-
Business Unit.
-
Health.
-
Project Class.
-
Type. Color indicates Proposal, Project, or Asset.
Size of bubble indicates
Specifies what the various sizes of the bubbles (lifecycle entities) represent. Options are as follows:
-
Projected Cost. Projected cost of the lifecycle entity. This is the default option.
-
Benefit. Financial benefit of the lifecycle entity.
-
Resource. Staffing profile of the lifecycle entity.
-
Value. Value Rating of the lifecycle entity, as described in Determining Value and Risk Ratings.
-
Risk. Risk Rating of the lifecycle entity, as described in Determining Value and Risk Ratings.
-
Score. Total Score of the lifecycle entity, as described in Determining Value and Risk Ratings.
-
Nominal Return. If enabled, nominal return for the lifecycle entity, calculated as described in Total Nominal Return.
-
Net Present Value. If enabled, net present value (NPV) for the lifecycle entity, calculated as described in Net Present Value (NPV).
-
Custom Field Value. If enabled, Custom Field Value of the lifecycle entity, as described in the Portfolio Management Configuration Guide.
-

The Analyze Current Portfolio portlet provides the same bubble chart as the Analyze Current Portfolio page. The preferences you can edit for this portlet are the same as the filter fields for the Analyze Current Portfolio page.


