
Share this page


View project cost
PPM provides multiple visualizations for project managers to view project cost. These visualizations focus on different areas. You can choose from them depending on what you would like to know.
View project cost from project header
The header of the project overview page provides a quick access to projected cost, actual cost, and budget.
Note: The Projected Cost widget is only available when it is set to be shown in the project settings.
Projected Cost and Actual Cost are derived from the project financial summary, only calculating the data that occur during the project plan period.
- When Budget >= Projected Cost, Actual Cost is displayed in dark green and Projected Cost is displayed in light green.
- When Budget < Projected Cost, Actual Cost is displayed in red and Projected Cost is displayed in pink.
- When budget <= 0, a yellow triangle with an exclamation mark is displayed.

View project cost from Project Cost portlet
You can add and view the Project Cost portlet in the Project Overview page or in your personal dashboard page.
|
Cost |
Description |
|---|---|
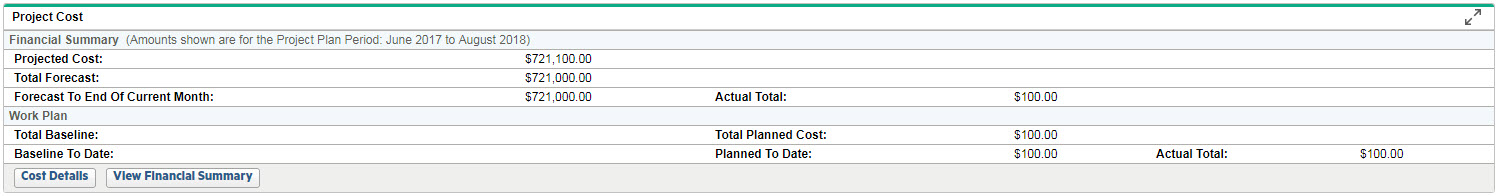
| Financial Summary | |
| Projected Cost |
Total cost required to complete the project. It is estimated based on the current progress. Projected Cost = the cost of each previous month + the cost of the current month + the cost of each future month. By default:
However, if the
|
|
Total Forecast |
Project's total forecast (planned) cost from the project's planned start period to the planned end period If the project is set to roll up forecast labor cost from the project's staffing profile, Total Forecast = Forecast cost that is manually entered in the financial summary + Forecast labor cost that is rolled up from the staffing profile; otherwise, it only includes the manually entered forecast cost. |
|
Forecast To End Of Current Month |
Project's total forecast (planned) cost from the planned start period to the end of the current month (or to the planned end period, whichever comes first) |
|
Actual Total |
Project's total actual cost from the project's planned start period to the planned end period If the project is set to roll up actual labor and non-labor cost from the project's work plan and time sheets, Actual Total = Actual cost that is manually entered in the financial summary + Actual labor and non-labor cost that is rolled up from the work plan and time sheets; otherwise, it only includes the manually entered actual cost. |
| Work Plan
This section is visible only when Financial Management for work plan is enabled. |
|
| Total Baseline |
Total planned cost of the active work plan baseline Total Baseline = Baseline planned labor cost + Baseline planned non-labor cost |
| Baseline to Date | Total planned cost of the active work plan baseline from the baseline's planned start date to the current date |
| Total Planned Cost |
Total planned cost of all work plan tasks PPM calculates work plan planned costs based on the task roles or the task resource roles, depending on the setting of the |
| Planned to Date | Total planned cost of all work plan tasks from the work plan's planned start date to the current date |
| Actual Total | Total actual cost of all work plan tasks |
Cost Details
Click Cost Details in the Project Cost portlet, you can see the above total cost is separated by expense type (capital and operating) and cost type (labor and non-labor).
View Financial Summary
Click View Financial Summary in the project Cost portlet to open the project financial summary. From the financial summary, you can:
- View forecast and actual labor cost and non-labor cost displayed by period.
- Manually enter forecast and actual labor cost and non-labor cost, if the project is set to allow manual adjustment on the actual labor and non-labor cost.
View project cost from Cost tab
The Cost tab in the Project Overview page includes four different views to display project related cost.
Note: The Cost tab is only available when it is set to be shown in the project settings.
Financial Summary view
This view helps you track forecast and actual cost, projected cost, and budget over the project's entire period. It provides project managers with a shortcut to the project's financial summary.
To view detailed description of the financial matrices such as projected cost, NPV, and Total Nominal Return, click the help icon in the table header.
The Forecast Cost, Actual Cost, and Budget for each month in the chart are accumulative values. For example, the Forecast Cost of the month Mar 14 is the sum value of this month and all the previous months.
Resource Forecast Cost view
The Resource Forecast Cost view is available only when a staffing profile is created for the project. This view helps you understand the forecast cost that is spent on different positions and resources, giving you an insight into what will be cost by the resources planned.
Amounts shown in this view are calculated for the project plan periods.
- Click the help icon in the chart header to know how the resource forecast cost is calculated.
- You can compare the resource forecast cost against the baselines in the chart. The chart displays the monthly total resource cost in the staffing profile baseline as well as the monthly total resource cost in active staffing profile. This helps project managers to get an understanding of the cost variance on the resources.
- You can also expand the plus sign in front of a position to view the cost per resource per month.
Work Plan Cost view
The Work Plan Cost view helps you understand the planned and actual cost generated from the project work plan.
- Click the help icon in the chart header to know how the baseline cost, planned cost, and actual cost are calculated.
- The Work Plan Cost chart is only available when the project is integrated with Time Management.
- The planned and actual cost are categorized by cost type (labor and non-labor) and expense type (operating and capital).
- Click the View details for the Actual Cost link to go to the work plan Actuals view.
Earned Value Analysis view
Earned Value Analysis (EVA) is an industry standard method of measuring a project's progress at a given point in time, forecasting its completion date and final cost, and analyzing variances in the schedule and budget as the project proceeds. It compares the planned amount of work with what has actually been completed, to determine if the cost, schedule, and work accomplished are progressing in accordance with the plan.
The Earned Value Analysis view helps you quantify the performance of a project and forecast how the project will do in the future.
-
Click the help icon in the chart header to learn how the EVA related measurements, such as Planned Value, Actual Value, Earned Value are calculated in PPM.
Note: When the structure of a work plan has been changed, the values for Planned Value, Earned Value, CPI, and SPI become 0 after the Cost Rollup Service runs. To obtain these values for earned value analysis purpose, after any work plan structure change, recreate a new baseline for your project.
-
You can leverage the optimization tool available in this view to model the impact on budget and schedule by adjusting project scope, and saving and comparing different scenarios.
To compare different scenarios by using the optimization tool:
-
Drag the slider to change the scope. This determines how BAC changes.
For example, if you drag the slider to -50%, the new BAC = the original BAC * (1-50%); if you drag the slider to 50%, the new BAC = the original BAC * (1+50%).
The Earned Value Analysis chart and the values of EAC, EAC(T), and TCPI are changed as the baseline cost is adjusted.
- Click Save the scenario as.
- Provide a name for the scenario in the Save As dialog box.
- Click Confirm.
-
Repeat from step 1 to step 4 to create other scenarios.
You can create up to three scenarios at a time. PPM does not save the scenarios you created. They are wiped out when you leave the Cost tab.
-
Click Compare scenarios.
The Compare Scenarios window opens displaying Earned Value Analysis view in different scenarios.
-

