Scenario 5: Unmet Demand Calculation when Forecasted Demand is Viewed on the Resource Pool Page
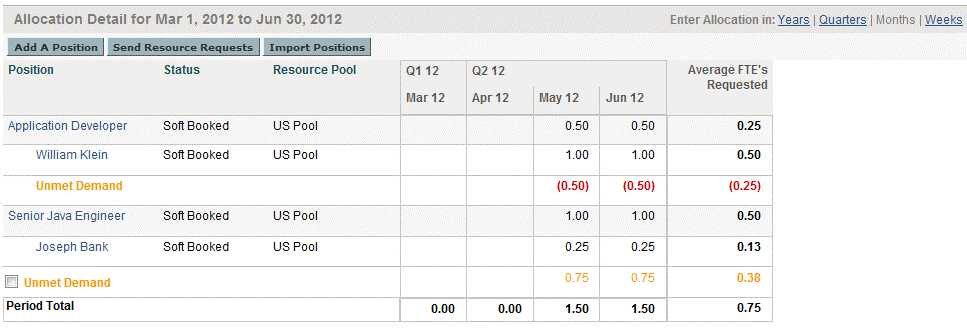
In the following example, Project E requires application developers and senior java engineers for May and June from US Pool. Staffing requirements are 1/2 FTE on application developer for May and June, and one FTE on senior java engineer for May and June.
William Klein is an application developer who has 100% of his time allocated in May and June to Project E. Joseph Bank is a senior java engineer who has 25% of his time allocated in May and June to Project E.
Figure B-9. Allocation Detail for Project E in FTEs View shows the unmet demand on the Staffing Profile page.
Figure B-9. Allocation Detail for Project E in FTEs View

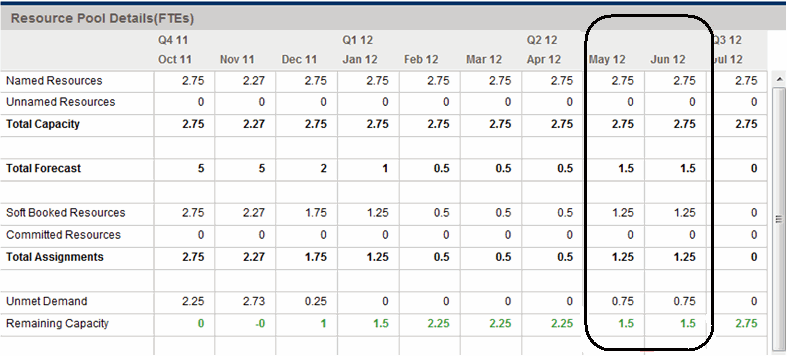
Figure B-10. Resource Pool Details for Project E in FTEs View shows the unmet demand on the Resource Pool page.
Figure B-10. Resource Pool Details for Project E in FTEs View

Table B-7. Example Unmet Demand Calculations for Project E lists the total capacity, forecast, assignment and unmet demand calculation for Project E on the Resource Pool page.
When viewing forecasted demand on the Resource Pool page (In ARP portlet and View Forecasted Demand on the Resource Pool page), you can find that the negative unmet demand (that is, an overbooking on one position) is ignored when unmet demand for the entire resource pool is displayed. This is because you are interested in the real unmet demand for a resource pool, and do not want the negative unmet demand for position application developer to offset the positive unmet demand for position senior java engineer for a fixed period.


